Data and graphing worksheets for 4th grade: Free & Printable
Are you ready to take your 4th graders' data analysis skills to the next level? Look no further! Use these brilliant data and graphing worksheets for 4th grade and help your 4th graders discover how graphs work and understand and interpret data.
-
Whether your students are just starting to explore the world of graphs or are looking to sharpen their skills, this article will introduce them to data and graph learning in a fun and exciting way.
We’ll also encourage you to visit our website Mathskills4kids.com, offering a range of exciting data and graphing worksheets for all grades and difficulty levels to meet your children’s needs. You can download or print them and use them at home with your kids.
From bar graphs to pie charts: Exciting worksheets for 4th Grade data analysis
From bar graphs to pie charts, our exciting worksheets for 4th-grade data analysis, get prepared to engage and challenge your students like never before. In this article, we aim to uplift your 4th graders’ skills in interpreting, creating bar graphs, and understanding percentages with pie charts. By so doing, they will become data analysis experts.
Data analysis is a skill that can help 4th-grade students in many ways throughout their life. It can also be a lot of fun and rewarding. However, our data and graphing worksheets consist of visually appealing graphics and interactive activities that will make learning about data analysis a breeze.
So, get ready to see their confidence soar as they discover the power of visual representation and make connections between data sets. Use this opportunity to enhance your 4th graders' math education with our dynamic and engaging worksheets!
-
BROWSE THE WEBSITE
-
DOWNLOAD FREE WORKSHEETS
-
-
4th GRADE MATH TOPICS
- Number sense
- Addition
- Subtraction
- Multiplication
- Division
- Mixed operations
- Variable expressions
- Functions
- Coordinate plane
- Data and graphs
- Logical reasoning
- Patterns and sequences
- Money math
- Units measurement
- Telling time
- Equivalent fractions
- Compare & order fractions
- Add & subtract fractions with like denominators
- Add & subtract fractions with unlike denominators
- Multiply fractions
- Decimals
- Add and subtract decimals
- Probabilities and statistics
- 2D shapes
- Triangles and quadrilaterals
- Symmetry
- Angles
- 3D shapes
- Geometric measurement
-
-
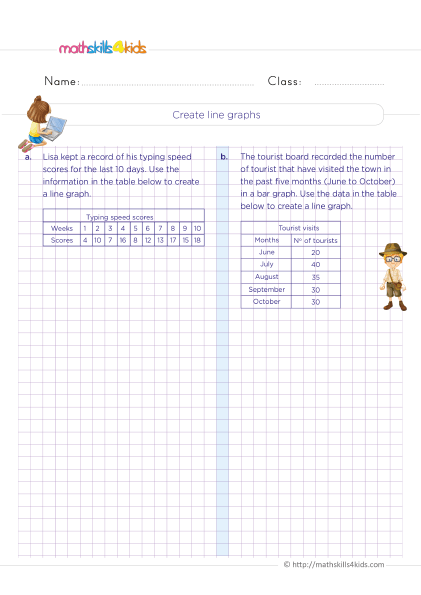
Create and interpreteline graphs
 Print it...
-
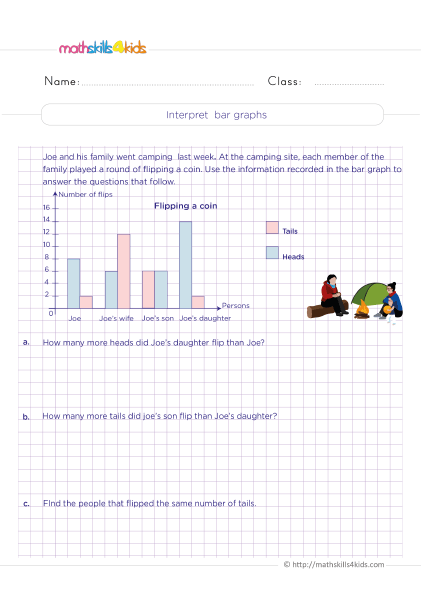
How to interpret bar graphs
 Print it...
-
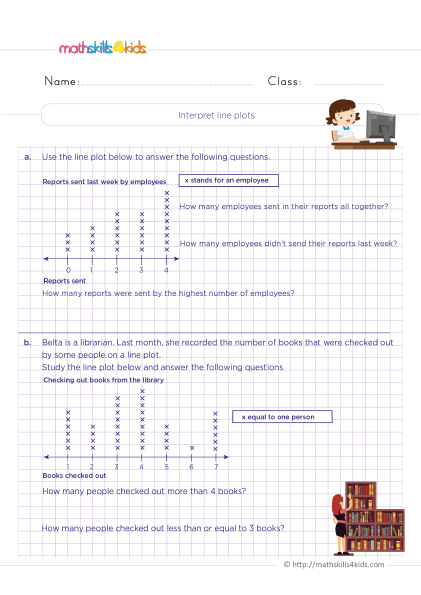
How do you interpret line plots?
 Print it...
-
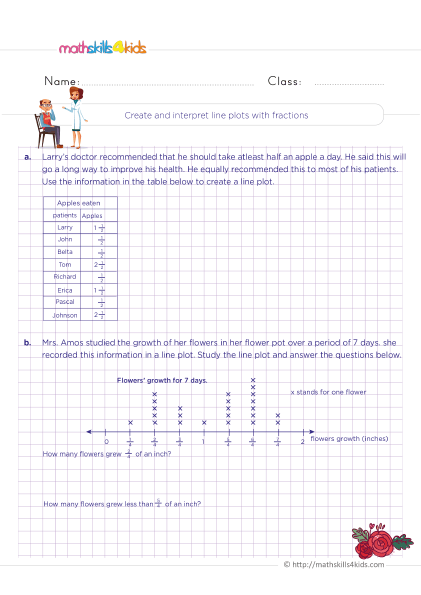
Create and interpret line plots with fractions
 Print it...
-
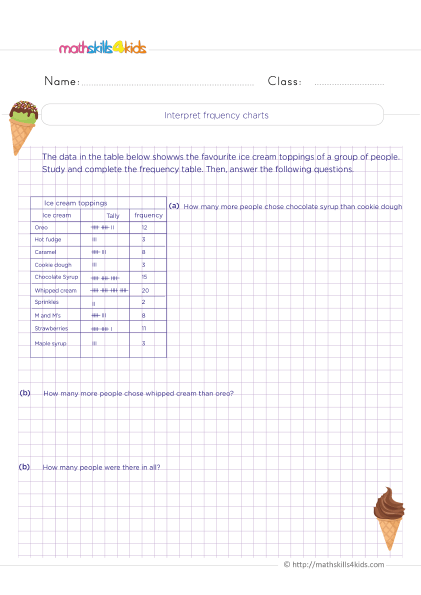
Understanding how to interpret frequency charts
 Print it...
-
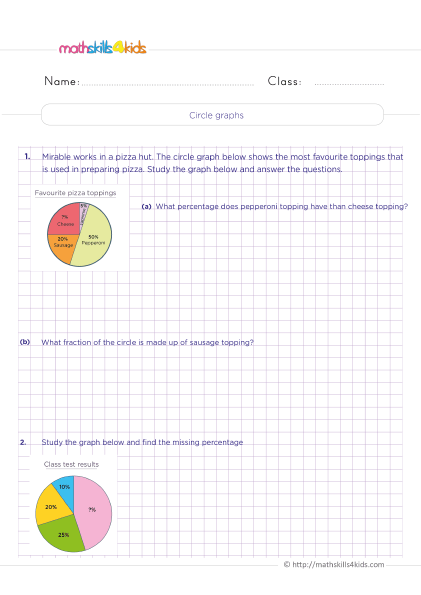
What fraction does one section in this circle graph represent?
 Print it...
-
Create and interpreteline graphs
-
Buying is supporting us!
Buy Now...
-
-
Importance of teaching data analysis skills at an early age
In today’s driven world, teaching data analysis skills to kids at an early age is important for many reasons.
First, by teaching data and graphs at an early age, we can prepare students to navigate and make sense of the vast amount of information they encounter. Also, data analysis empowers students to make informed decisions, solve problems, and communicate effectively.
Moreover, it helps develop critical thinking, logical reasoning, and mathematical skills essential for success in various fields. Above all, introducing data analysis skills in 4th grade lays the foundation for building strong data literacy among students.
-
Types of graphs and charts used in data analysis
In data analysis, graphs and charts are powerful tools for visually representing data and making it easier to understand. Several types of graphs and charts are commonly used in data analysis, each with its purpose and advantages.
The most common types include bar graphs, line graphs, and pie charts.
Bar graphs: how to create and interpret them
Bar graphs are a popular choice for displaying categorical data. They consist of rectangular bars of various lengths, each representing a different category or group. To create a bar graph, students will collect data, organize it into categories, and then plot the data on the graph.
Interpreting a bar graph involves analyzing the lengths of the bars to understand the relationships between different categories. Students can compare the heights of the bars to determine which category has the highest or lowest value. They can also identify patterns or trends in the data by examining the relative heights of the bars.
Line graphs: a visual representation of data trends
Line graphs are used to show the relationship between two variables. They are beneficial for displaying data that changes over time. In a line graph, data points are plotted on a grid, and lines are drawn to connect these points. Students can visualize the trend or pattern in the data by connecting the dots.
Line graphs help students understand how variables are related and how they change in response to different factors. They can also make predictions or extrapolate data beyond the plotted points.
Pie charts: understanding proportions and percentages
Pie charts are circular graphs divided into slices, each representing a different category or group. The size of each slice corresponds to the proportion or percentage of the whole. Pie charts are useful for showing how a whole is divided into parts and comparing the sizes of different categories.
Students can analyze a pie chart to understand each category's relative proportions and percentages. They can also calculate angles to determine the exact percentage represented by each slice.
-
Choosing the right graph or chart for different types of data
Choosing the appropriate graph or chart for a given data set is crucial for effective data analysis. Different types of data require different visualization types to convey the information accurately.
- When choosing a graph or chart, students should consider the following:
- The nature of the data,
- The relationships they want to highlight,
- The message they want to communicate.
- For categorical data, bar graphs or pie charts are typically used.
- For numerical data, line graphs or scatter plots may be more appropriate.
Students can make informed decisions and effectively present their data by understanding the characteristics and purposes of each graph or chart.
-
Engaging data and graphing worksheets for 4th graders practicing data analysis skills
To help your 4th graders practice and reinforce their data analysis skills, we have curated engaging data and graphing worksheets from Mathskills4kids.com that cover various topics and difficulty levels.
Our worksheets are designed to be visually appealing and interactive, making the learning process enjoyable and effective. Each worksheet has clear instructions and examples to guide students through data analysis.
From simple bar graphs to complex pie charts, our Mathskills4kids’ worksheets will provide ample opportunities for students to practice creating, interpreting, and analyzing data visualizations.
Above all, our worksheets will improve students’ math skills and develop critical thinking and problem-solving abilities.
-
Incorporating real-life examples into data analysis exercises
To make data analysis more meaningful and relatable, it is essential to incorporate real-life examples into the exercises. In line with this, Mathskills4kids.com have you covered with familiar contexts, such as sports, weather, or favorite foods, where students can see the practical applications of data analysis in their everyday lives.
These real-life examples will make the learning experience more engaging and memorable. Students can collect and analyze data related to their interests or conduct surveys to gather data from their peers.
Also, by connecting data analysis to real-world scenarios, students will develop a deeper understanding of the subject and appreciate its relevance.
Bonus: Data and graphing worksheets for 4th Graders further learning and practice
In addition to our exciting data and graphing worksheets for 4th Grade, various online resources and tools are available to further your 4th graders' data analysis skills and concepts learned in the classroom.
These resources offer various activities, from virtual experiments to advanced data analysis simulations. Encouraging students to explore these resources independently can foster a sense of curiosity and self-directed learning. We can provide students with a well-rounded data analysis education by leveraging technology and digital tools.
Here are some examples:
- K5 Learning: This website offers free worksheets, flashcards, and inexpensive workbooks on 4th graders’ pie charts, line graphs, and more challenging data sets, including pie graphs with fractions. However, the last set of worksheets introduces probabilities. https://www.k5learning.com/free-math-worksheets/fourth-grade-4/data-graphing.
- com: This website has a huge collection of worksheets on data and graphing skills, such as interpreting graphs, making graphs, comparing data, and more. They are suitable for different levels of difficulty. You can practice in the classroom or at home. https://www.education.com/worksheets/fourth-grade/data-and-graphing/.
- com: This website has interesting videos on data and graphs topics like stem-and-leaf plots, bar graphs, tables, etc. You'll also find multiple-choice lesson quizzes and a chapter test to help supplement your 4th-grade data and graphing practice. https://study.com/academy/topic/4th-grade-math-data-graphs.html.
These are just some of the resources and tools we recommend for 4th graders wanting to learn more about data analysis. We hope you find them useful and interesting.
-
Thank you for sharing the links of MathSkills4Kids.com with your loved ones. Your choice is greatly appreciated.
Conclusion: Keep Practicing and Have Fun
In conclusion, teaching data analysis skills to 4th graders is essential for their academic and personal development. Introducing students to graphs and charts enables them to comprehend complex information, make informed decisions, and communicate effectively.
Data analysis is a valuable skill that transcends mathematics boundaries and applies to various aspects of life. With our dynamic and engaging data and graphing worksheets for 4th grade, we aim to empower students to become confident data analysts with the skills they need to succeed in the data-driven world.
So, take advantage of this opportunity to enhance your students' math education and set them on the path to becoming data analysis experts!