Grade 6 Statistics Worksheets PDF: Statistical Questions with Answers
-
Whether your child is struggling with statistics or simply looking for an extra challenge, this article is for you. This article will provide many teaching and learning opportunities and resources where you’ll find the best Grade 6 statistics worksheets PDF. In line with this, Mathskills4kids.com is your number-one website with thousands of brilliant math worksheets, including simple statistical questions with answers you can download and solve with your kids.
How to use statistical questions to enhance your 6th grade math curriculum
Are you looking for a fun and engaging way to teach statistics to your 6th-grade students? Do you want to help them develop critical thinking and problem-solving skills? If so, you will love this article!
This article will teach you how to use statistical questions to enhance your 6th-grade math curriculum. You will also find some awesome worksheets you can download and print for free to practice with your students. We’ll also cover some interesting topics like:
- What are statistics, and why are they important for 6th graders?
- What is a statistical question, and how to identify one?
- How to collect data to answer a statistical question.
- How to organize and display data using tables, charts, and graphs.
- How to analyze data and draw conclusions from it.
- How to communicate the results of a statistical analysis.
- And more…
-
BROWSE THE WEBSITE
-
DOWNLOAD FREE WORKSHEETS
-
-
GRADE 6 MATH TOPICS
- Whole numbers
- Multiplication
- Division
- Exponents and square roots
- Number theory
- Decimals
- Add & subtract decimals
- Multiply & divide decimals
- Fractions & mixed numbers
- Add & subtract fractions
- Multiply fractions
- Divide fractions
- Integers
- Operations with integers
- Mixed operations
- Rational numbers
- Problems solving
- Ratio & proportions
- Percentages
- Measuring units
- Money math
- Consumer math
- Telling time
- Coordinate graph
- Algebraic expressions
- One step equations
- Solve & graph inequalities
- Two-step equations
- 2D Geometry
- Symmetry & transformation
- 3D Shapes
- Geometry measurement
- Data and Graphs
- Statistics
- Probability
-
-
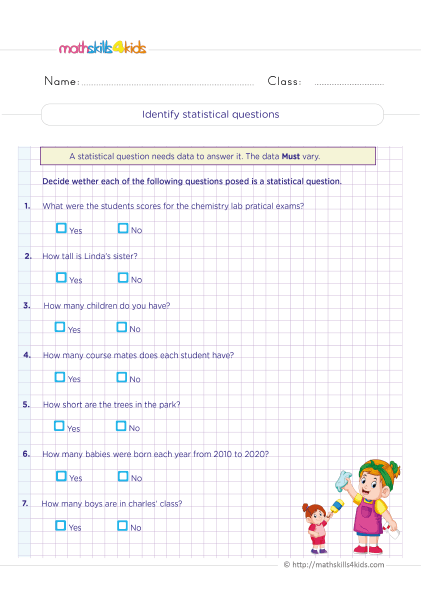
Identifying statistical questions practice
 Print it...
-
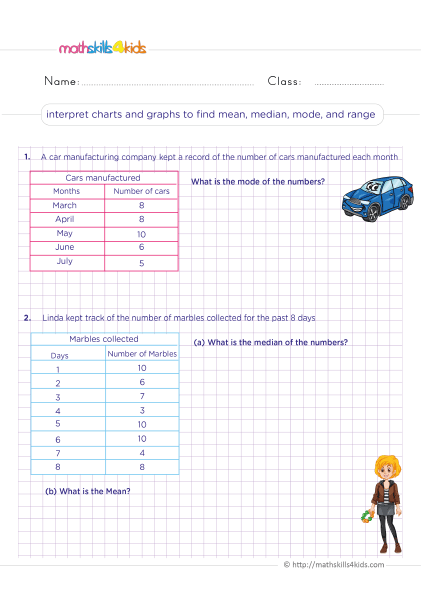
Interpret charts and graphs to find mean, median, mode and range
 Print it...
-
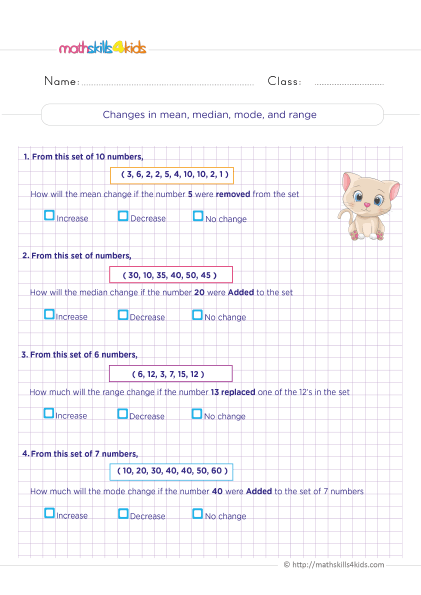
How changing a value affects the mean and median
 Print it...
-
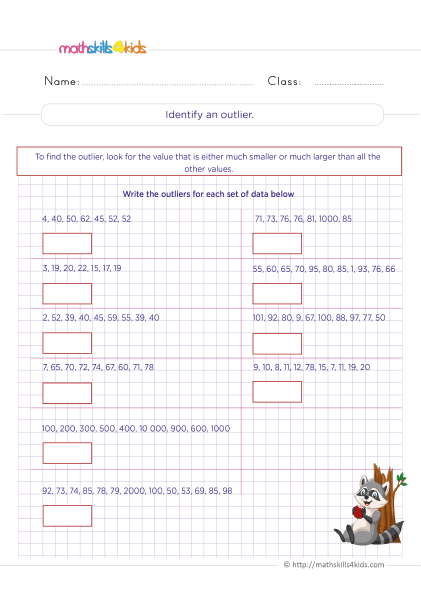
Finding outliers in data practice - Ways to detect the outliers
 Print it...
-
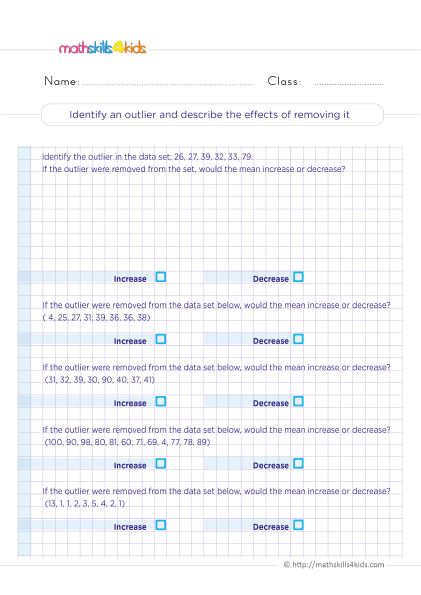
Identify an outlier and describe the effects of removing it
 Print it...
-
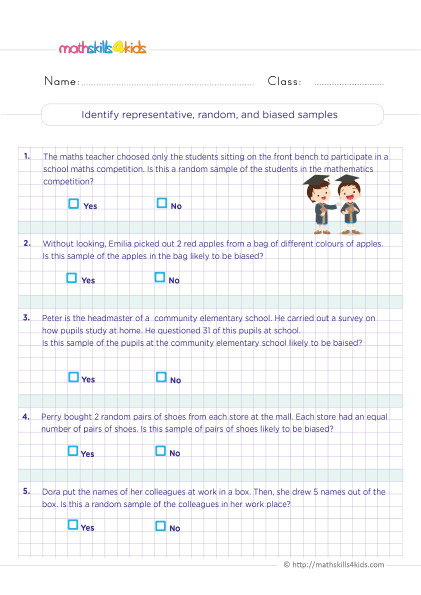
Identify representative random and biased samples
 Print it...
-
Identifying statistical questions practice
-
Buying is supporting us!
Buy Now...
-
-
What are statistics, and why are they important for 6th graders?
Statistics is the science of collecting, organizing, analyzing, and interpreting data. Statistics can help us answer questions about the world, such as:
- How many people live in a particular country?
- What is the average height of a basketball player?
- How likely is it to rain tomorrow?
- How effective is a new vaccine against a disease?
Statistics are important for 6th graders because they help them develop critical thinking and problem-solving skills. By learning how to use statistics, 6th graders can:
- Make sense of data and information in the real world
- Compare and contrast different sets of data
- Identify patterns and trends in data
- Make predictions and inferences based on data
- Evaluate the validity and reliability of data sources
- Communicate their findings and arguments using data
Statistics are also fun and engaging for 6th graders because they can explore exciting topics like sports, animals, music, or games. Statistics can help them discover new facts and insights about their favorite subjects.
However, not all questions are statistical questions. A statistical question can be answered by collecting data from a group of people or things and analyzing the variation in the data. For example, "How many pets do 6th graders have?" is a statistical question because we can collect data from a sample of 6th graders and see how many pets they have. The answer will vary depending on the sample we choose.
On the other hand, a non-statistical question has a fixed or definite answer that does not depend on the data. For example, "How many legs does a dog have?" is a non-statistical question because the answer is always four, no matter which dog we look at.
Ready to dive in? Let's get started!
-
What is a statistical question, and how to identify one?
A statistical question is a question that can be answered by collecting and analyzing data. A statistical question usually has more than one possible answer, and the answer may vary depending on the data. For example, "How tall are the students in your class?" is a statistical question because the answer will depend on the heights of the different students in your class. You can collect data by measuring the heights of all the students, and then you can analyze the data to find the average, the range, the mode, or other statistics that describe the distribution of heights.
On the other hand, a non-statistical question has a fixed or definite answer that does not depend on the data. For example, "How many legs does a dog have?" is a non-statistical question because the answer is always four, no matter which dog we look at.
To identify a statistical question, you can ask yourself: Does the question have more than one possible answer? Does the answer depend on the data? If the answer is yes to both questions, then it is a statistical question. If the answer is no, then it is a non-statistical question.
-
Examples of statistical questions and non-statistical questions
Here are some examples of statistical questions and non-statistical questions. See if you can identify which ones are which.
- How many books are in your school library?
- What is the most popular genre of books among 6th graders?
- How many pages are in Harry Potter and the Sorcerer's Stone?
- What is the average number of books read by 6th graders per month?
- How many words are in this article?
- What is the median score on the last math test in your class?
- How many states are in the United States of America?
- What is the mode of eye colors in your class?
The statistical questions are:
- What is the most popular genre of books among 6th graders?
- What is the average number of books read by 6th graders per month?
- What is the median score on the last math test in your class?
- What is the mode of eye colors in your class?
The non-statistical questions are:
- How many books are in your school library?
- How many pages are in Harry Potter and the Sorcerer's Stone?
- How many words are in this article?
- How many states are in the United States of America?
-
How to collect data to answer a statistical question
To answer a statistical question, you need to collect data that are relevant to the question. Data are pieces of information that can be measured or counted. For example, if you want to answer the question "How tall are the students in your class?" you need to collect data on the heights of all the students in your class.
There are different ways to collect data, depending on what we want to measure or count. Here are some common methods:
- Survey: A survey is a way of asking people questions and recording their answers. We can use a survey to collect data on opinions, preferences, habits, or other characteristics of a group of people. For example, if you want to answer the question "What is the most popular genre of books among 6th graders?", you can use a survey to ask 6th graders what kind of books they like to read.
- Experiment: An experiment tests a hypothesis or idea by changing one variable and observing its effect on another variable. We can use an experiment to collect data on cause-and-effect relationships or how things work. For example, if you want to answer the question "How does temperature affect plant growth?", you can use an experiment to grow plants under different temperatures and measure their heights.
- Observation: An observation is a way of watching and recording what happens naturally without interfering or changing anything. We can use observation to collect data on behaviors, events, or phenomena that occur in real life. For example, if you want to answer the question "How often do birds visit your backyard?" you can use an observation to count how many birds you see in your backyard over a period of time.
When collecting data, ensure that your data are:
- Accurate: Your data should reflect reality as closely as possible. Avoid errors or mistakes that could affect your measurements or counts. For example, if you are measuring heights, use a ruler or tape measure calibrated correctly and with clear markings.
- Reliable: Your data should be consistent and repeatable. You should get similar results if you repeat your method or use different data sources. For example, if surveying 6th graders, use a large and representative sample of 6th graders from different schools or regions.
- Valid: Your data should be relevant and appropriate for your question. You should collect data that can help you answer your question and avoid data that are not related or useful. For example, if you are testing plant growth, measure the plants' height, not the flowers' color.
-
How to organize and display data using tables, charts, and graphs
After collecting data, we need to organize and display them in a way that makes sense and is easy to understand. We can summarize and visualize our data using tables, charts, and graphs. Tables, charts, and graphs show the same data but have different advantages and disadvantages.
A table is a way of organizing data in rows and columns. A table can show the exact values or numbers of our data. A table is suitable for comparing data or looking for patterns or trends. However, a table can be hard to read or interpret if it has too many rows or columns or too much information.
A chart is a way of displaying data using symbols, shapes, colors, or pictures. A chart can show the relative sizes or proportions of your data. A chart is good for showing categories or groups of data or highlighting differences or similarities. However, a chart can be misleading or inaccurate if it does not match the scale or units of your data.
A graph is a way of plotting data using points, lines, bars, or curves. A graph can show the relationship or correlation between two or more variables of your data. A graph is good for showing changes or trends over time or space or how one variable affects another. However, a graph can be confusing or unclear if it does not have labels, titles, legends, or scales.
There are different types of tables, charts, and graphs that you can use depending on what kind of data you have and what you want to show. Here are some examples:
- Frequency table: A frequency table is a table that shows how often each value or category of a variable occurs in your data. For example, if you want to show how many students in your class like each genre of books, you can use a frequency table like this:
Genre
Frequency
Fantasy
12
Mystery
8
Science Fiction
6
Historical Fiction
4
Nonfiction
2
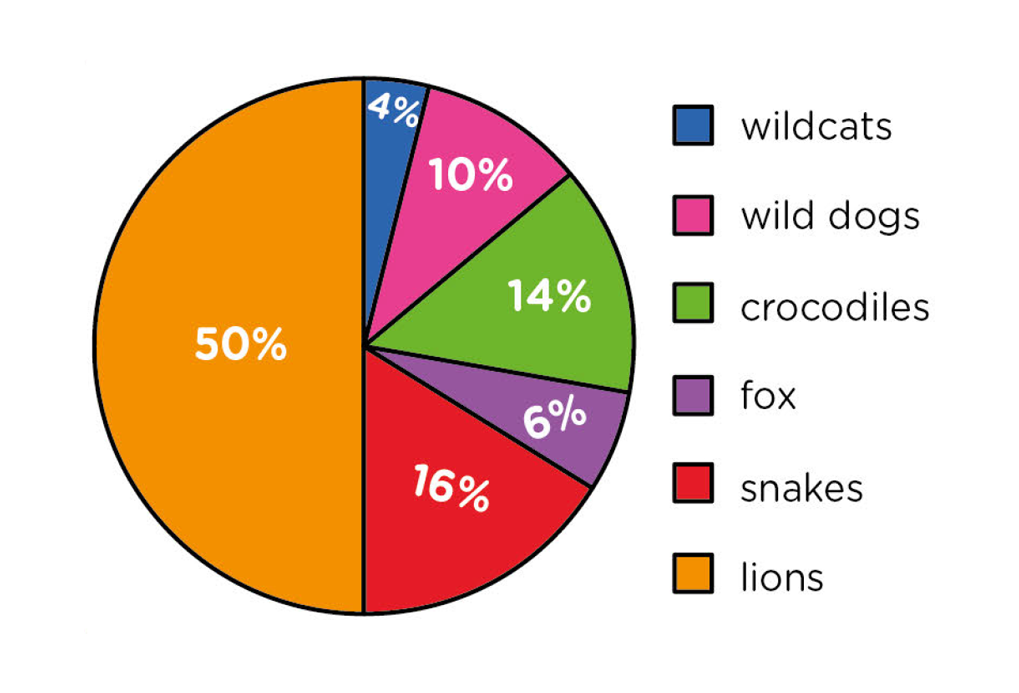
- Pie chart: A pie chart shows the percentage or fraction of each value or category of a variable in data. For example, if you want to show how much the different percentages of animals hosted in a zoo, you can use a pie chart like this:
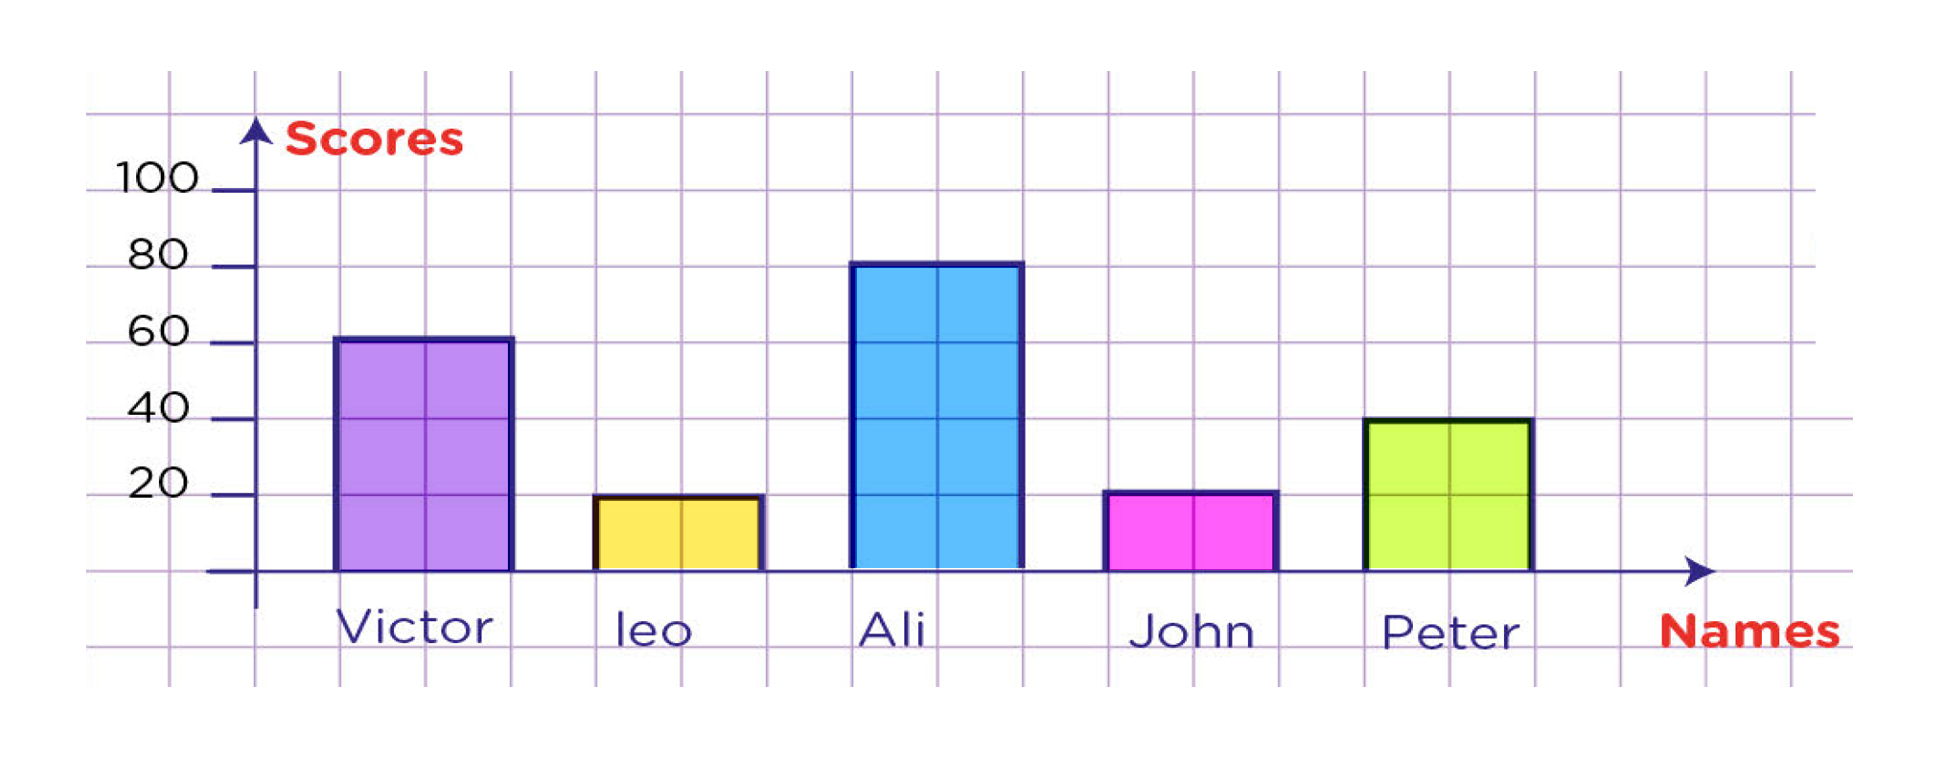
- Bar graph: A bar graph shows the quantity or frequency of each value or category of a variable in data using vertical or horizontal bars. For example, if you want to show the average score on each subject test in your class, you can use a bar graph like this:
Line graph: A line graph shows the change or trend of a variable in data over time or space using points connected by lines. For example, if you want to show how the number of goals of a player varies during a period, you can use a line graph like this:
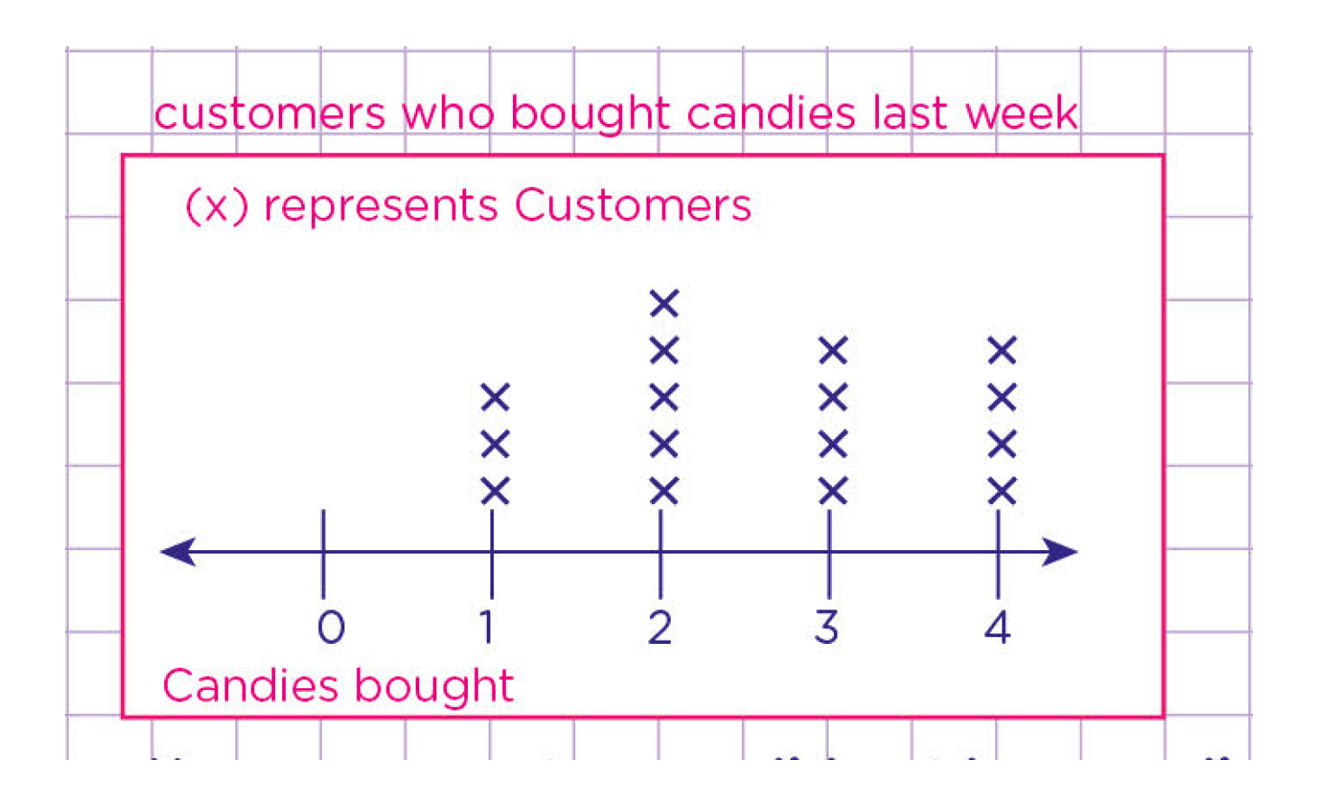
Line and plot: A line and plot graph shows the relationship between two variables in data using points connected by a line. For example, if you want to show how the number of candies bought by customers changes over days of the week, you can use a line and plot graph like this:
When making tables, charts, and graphs, we can follow these tips:
- We choose the best type of table, chart, or graph for our data and purpose
- We label our table, chart, or graph with a title and the names of the variables
- We must use appropriate scales and units for our table, chart, or graph
- We can use colors, shapes, symbols, pictures, or patterns to make our table, chart, or graph attractive and easy to read
- We can compare and contrast our table, chart, or graph with other sources of data or information
-
How to analyze data and draw conclusions from it
Once we have collected and organized our data, we need to analyze it and draw conclusions from it. This means we will look for patterns, trends, relationships, and differences in the data and explain what they mean. We will also compare our data with other sources of information, such as previous studies, theories, or expectations, and see if they agree or disagree with our findings.
There are different ways to analyze data, depending on the type and amount of data we have. Some common methods are:
- Calculating measures of central tendency, such as mean, median, and mode, to find the typical or average value of a set of data
- Calculating measures of variability, such as range, interquartile range, and standard deviation, to find how spread out or diverse a set of data is
- Calculating measures of relative position, such as percentiles and z-scores, to find how a value compares to the rest of the data
- Using inferential statistics, such as hypothesis testing and confidence intervals, to make generalizations or predictions about a population based on a sample
- Using descriptive statistics, such as frequency tables, histograms, box plots, scatter plots, and line graphs, to summarize and visualize the data
To draw conclusions from a data analysis, we must interpret the results and answer the statistical question we started with. We will also evaluate the quality and reliability of our data and analysis and identify any limitations or sources of error that may affect our conclusions. We should also suggest any possible improvements or extensions for our investigation.
-
How to communicate the results of a statistical analysis
The final step in a statistical investigation is to communicate the results of our analysis and conclusions to others. This can be done differently, depending on our audience and purpose. Some common ways are:
- Writing a report that summarizes the main findings and explains how we conducted the investigation
- Making a presentation that highlights the key points and uses visual aids such as charts and graphs
- Creating a poster that displays the most essential information and attracts attention
- Publishing an article that shares our results with a broader audience and contributes to the existing knowledge on the topic
When communicating our results, we should use clear and precise language, avoid jargon and technical terms, and provide definitions or explanations when necessary. We will also use appropriate units of measurement, round numbers to a reasonable degree of accuracy, and cite our sources of data and information.
We should also acknowledge any limitations or uncertainties in our results and avoid making claims not supported by clear evidence.
Bonus: Best resources online for more data and statistics practice in 6th Grade
If you want your students to learn more about data and statistics in 6th-grade math, here are some awesome resources online that you can use:
- Khan Academy: A free online platform that offers video lessons, interactive exercises, quizzes, and tests on various topics in math, including statistics (https://www.khanacademy.org/math/cc-sixth-grade-math/cc-6th-data-statistics)
- Math Goodies: A website that provides tutorials, worksheets, games, puzzles, and calculators on different aspects of statistics, such as mean, median, mode, range, histograms, box plots, stem-and-leaf plots, scatter plots, line graphs (https://www.mathgoodies.com/lessons/vol8/practice_unit8)
- Math is Fun: A website that explains math concepts in a fun and easy way, with examples, diagrams, animations, and activities on topics such as statistics, probability, and data analysis (https://www.mathsisfun.com/data/index.html)
- IXL: A personalized learning platform that offers adaptive practice problems, feedback, and awards on various skills in math, including statistics (https://www.ixl.com/math/grade-6)
-
-
Thank you for sharing the links of MathSkills4Kids.com with your loved ones. Your choice is greatly appreciated.
Conclusion
Statistics is an essential branch of mathematics that helps us collect, organize, analyze, and communicate data. By using statistical questions, we can enhance our 6th-grade math curriculum and learn how to investigate real-world problems and phenomena.
Statistics can help us understand the world better by revealing patterns, trends, relationships, and differences in data and allowing us to make generalizations or predictions based on evidence.
We hope you enjoyed this article and learned something new about statistics. Don't forget to download our free Grade 6 statistics worksheets from Mathskills4kids.com for your Grade 6 students to practice their skills.
Happy learning!