How to organize and display data using tables, charts, and graphs
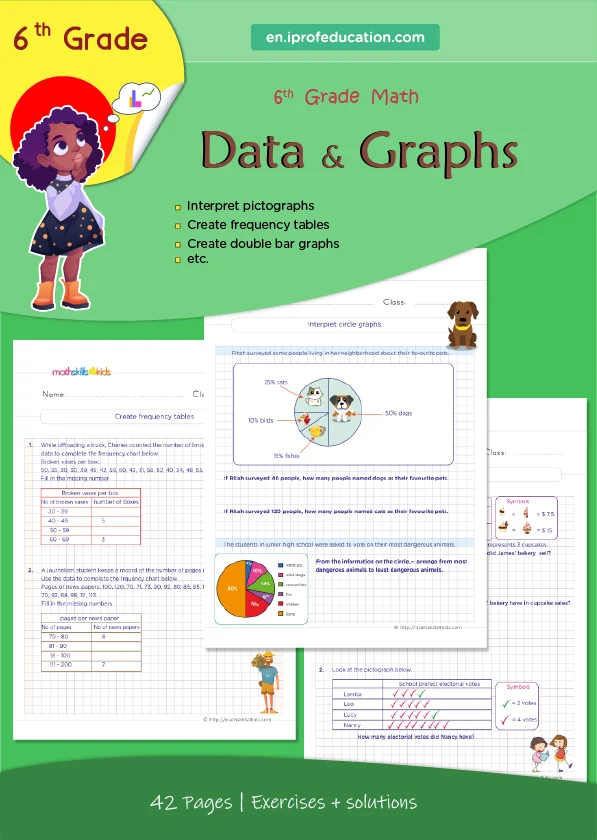
After collecting data, we need to organize and display them in a way that makes sense and is easy to understand. We can summarize and visualize our data using tables, charts, and graphs. Tables, charts, and graphs show the same data but have different advantages and disadvantages.
A table is a way of organizing data in rows and columns. A table can show the exact values or numbers of our data. A table is suitable for comparing data or looking for patterns or trends. However, a table can be hard to read or interpret if it has too many rows or columns or too much information.
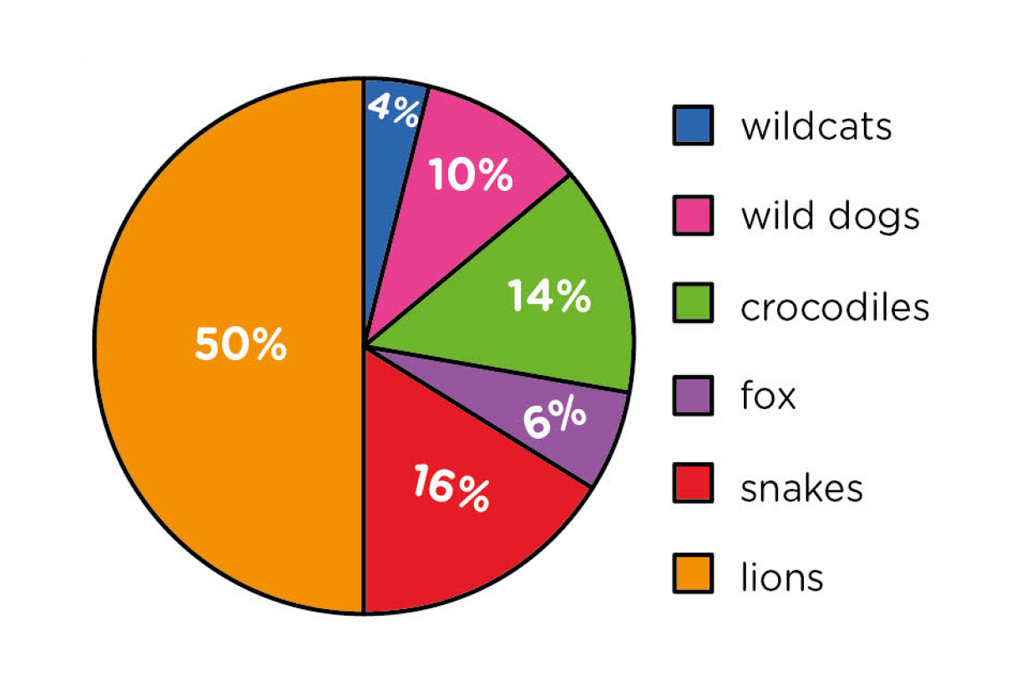
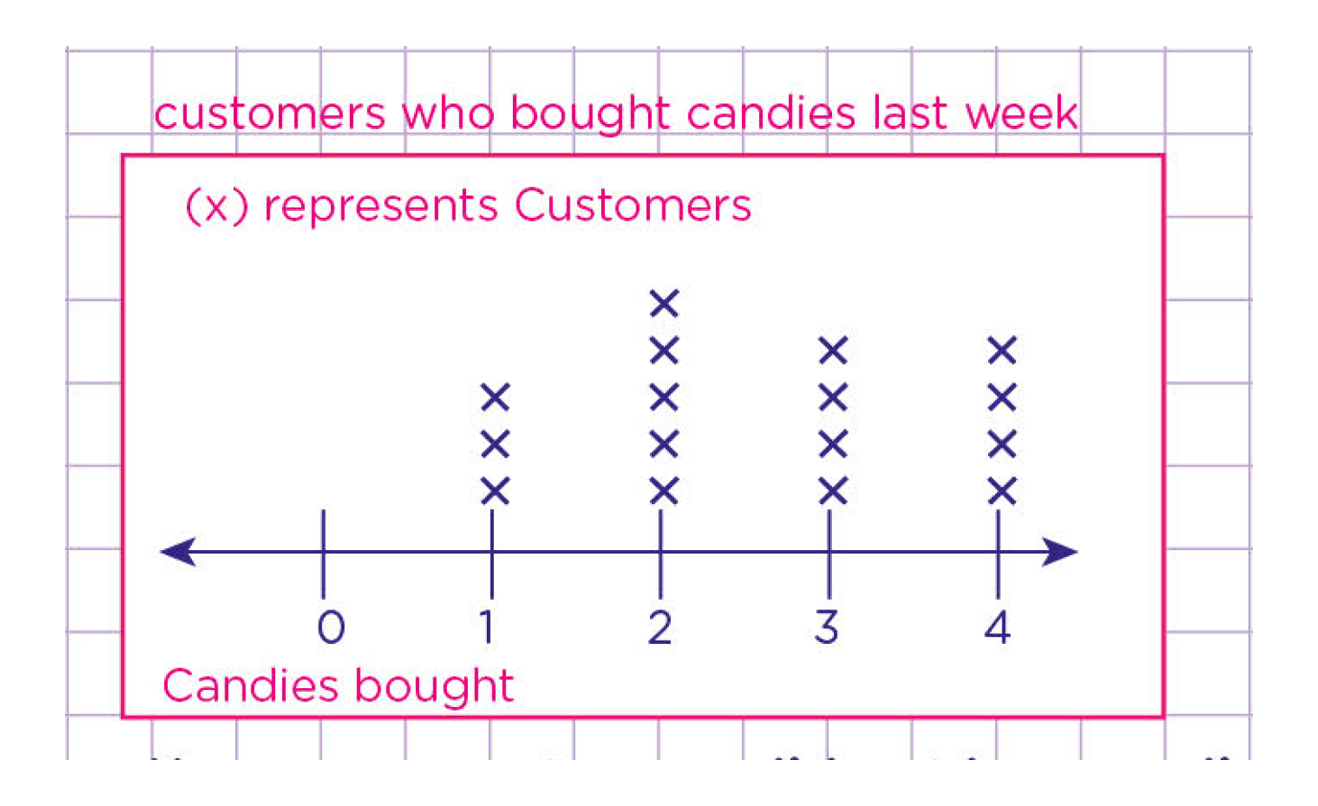
A chart is a way of displaying data using symbols, shapes, colors, or pictures. A chart can show the relative sizes or proportions of your data. A chart is good for showing categories or groups of data or highlighting differences or similarities. However, a chart can be misleading or inaccurate if it does not match the scale or units of your data.
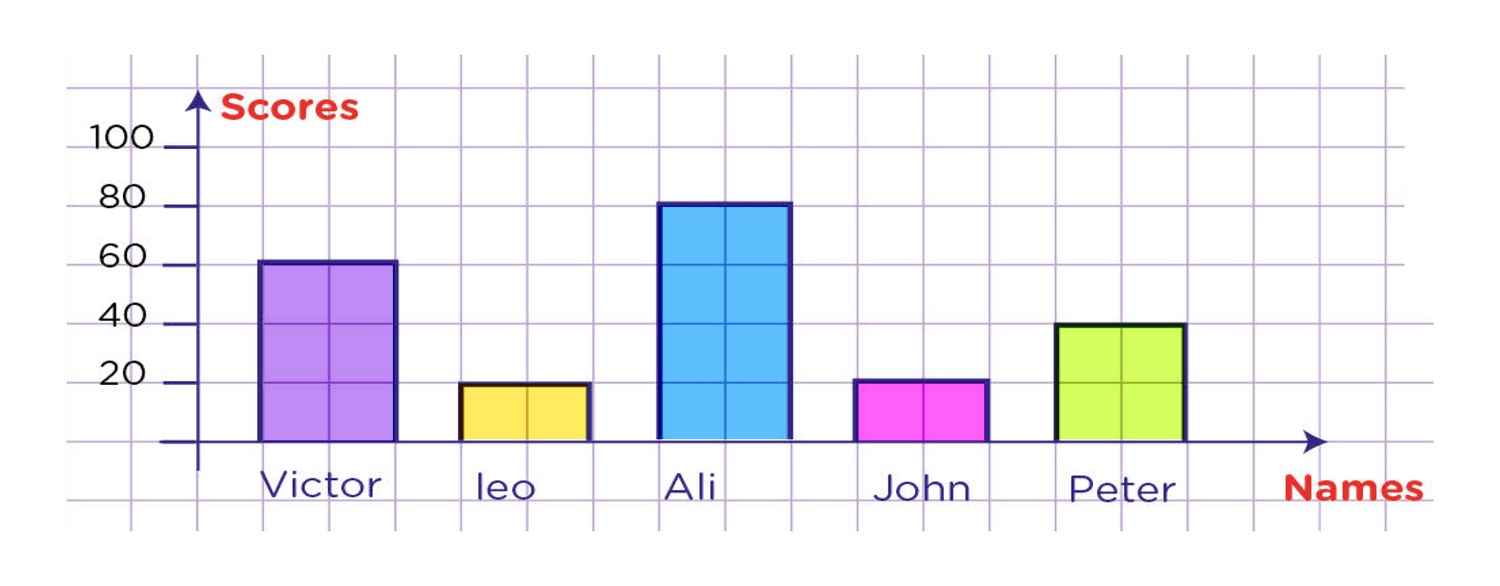
A graph is a way of plotting data using points, lines, bars, or curves. A graph can show the relationship or correlation between two or more variables of your data. A graph is good for showing changes or trends over time or space or how one variable affects another. However, a graph can be confusing or unclear if it does not have labels, titles, legends, or scales.
There are different types of tables, charts, and graphs that you can use depending on what kind of data you have and what you want to show. Here are some examples:
- Frequency table: A frequency table is a table that shows how often each value or category of a variable occurs in your data. For example, if you want to show how many students in your class like each genre of books, you can use a frequency table like this:
|
Genre
|
Frequency
|
|
Fantasy
|
12
|
|
Mystery
|
8
|
|
Science Fiction
|
6
|
|
Historical Fiction
|
4
|
|
Nonfiction
|
2
|
When making tables, charts, and graphs, we can follow these tips:
- We choose the best type of table, chart, or graph for our data and purpose
- We label our table, chart, or graph with a title and the names of the variables
- We must use appropriate scales and units for our table, chart, or graph
- We can use colors, shapes, symbols, pictures, or patterns to make our table, chart, or graph attractive and easy to read
- We can compare and contrast our table, chart, or graph with other sources of data or information