Make line plots and interpret data - Line plots with fractions practice
This free 5th grade make line plots and interpret data - line plots with fractions worksheet is a 2-page printable PDF made for 5th Grade math. Kids practice make line plots and interpret data - Line plots with fractions step by step, with clear instructions and plenty of room to write. The last page is the answer key, so kids can check their work or a grown-up can correct it in a minute.
What your child will practice: Make line plots and interpret data - Line plots with fractions
This sheet belongs to the Data and Graphs topic of 5th Grade. It focuses on one skill, make line plots and interpret data - Line plots with fractions, so kids can repeat the same kind of exercise until it feels easy.
- Read each instruction before starting.
- Solve the exercises in order: they get a little harder as you go.
- Show the work, not only the answer.
How to use this worksheet
- Download the PDF and print it (A4 or US Letter, “fit to page”).
- Read the instructions aloud with younger kids.
- Let your child work alone first, then help only where they get stuck.
- Check the answers with the answer key on the last page.
After the page: keep practicing
A few minutes a day works better than one long session. When this sheet feels easy, try the next one in the series or play a game on the same skill.
More practice: 5th Grade data and Graphs worksheets and games.
About this 5th Grade data and graphs worksheet
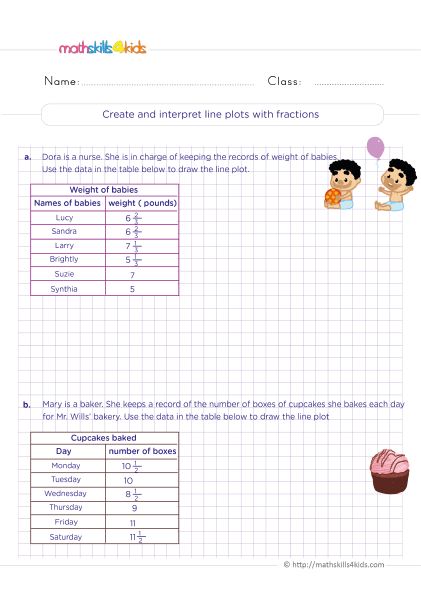
Download the worksheet: Make line plots and interpret data - Line plots with fractions practice
Download the PDF (opens in a new tab)Free · 2 pages · 1.3 MB · answer key included
🍪 Free worksheets are paid for by ads
To download for free, please accept cookies, or go Premium for an ad-free experience.
A few related activities
Create line graphs - How to draw a line graph using the data in the table
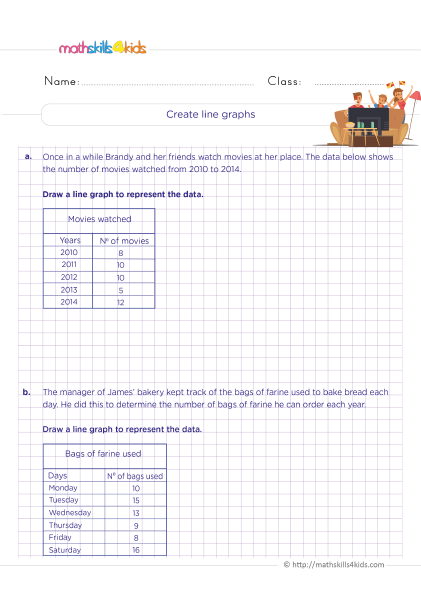
Printable PDF: 5th Grade data and Graphs practice, 2 pages, answer key included.
See the activity: Create line graphs - How to draw a line graph using the data in the tableInterpreting bar graph or chart - How do you interpret a graph?
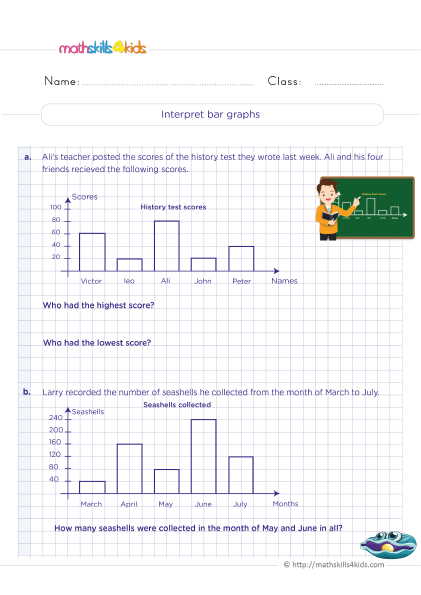
Printable PDF: 5th Grade data and Graphs practice, 2 pages, answer key included.
See the activity: Interpreting bar graph or chart - How do you interpret a graph?Creating bar graphs - How to draw a bar graph using the data in the table
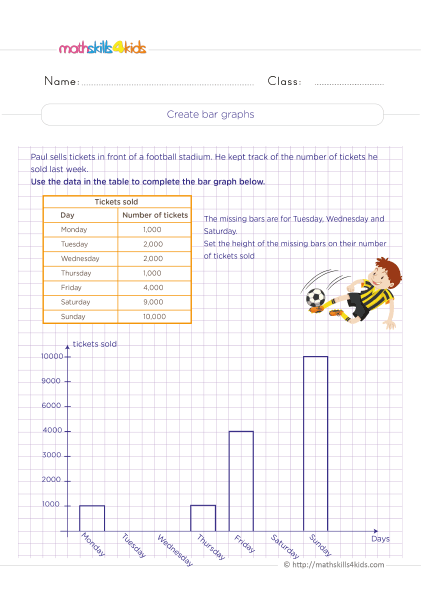
Printable PDF: 5th Grade data and Graphs practice, 2 pages, answer key included.
See the activity: Creating bar graphs - How to draw a bar graph using the data in the tableCreate pictographs by completing the missing data
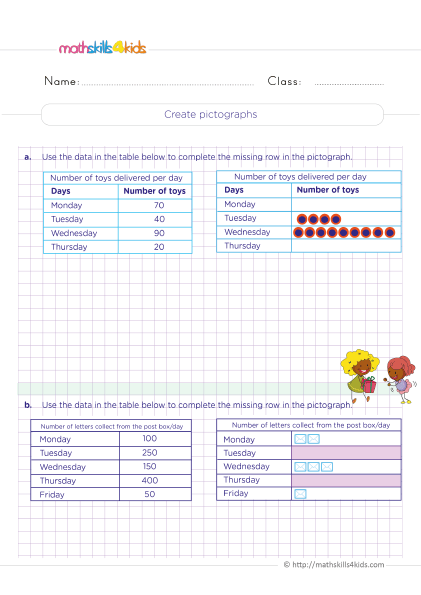
Printable PDF: 5th Grade data and Graphs practice, 2 pages, answer key included.
See the activity: Create pictographs by completing the missing dataReading line plots with whole numbers - Interpreting line plots
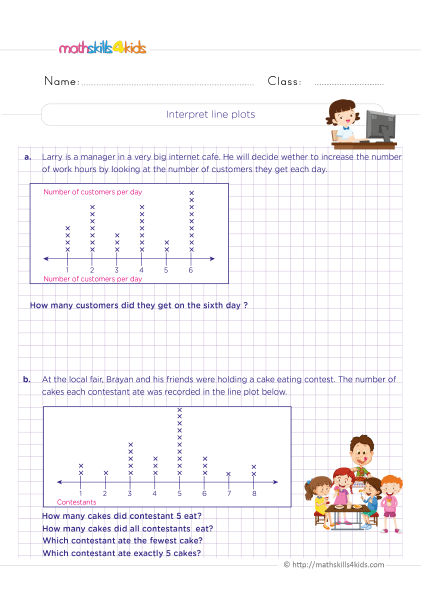
Printable PDF: 5th Grade data and Graphs practice, 2 pages, answer key included.
See the activity: Reading line plots with whole numbers - Interpreting line plotsPlace value to millions practice - Finding place value digits in whole numbers
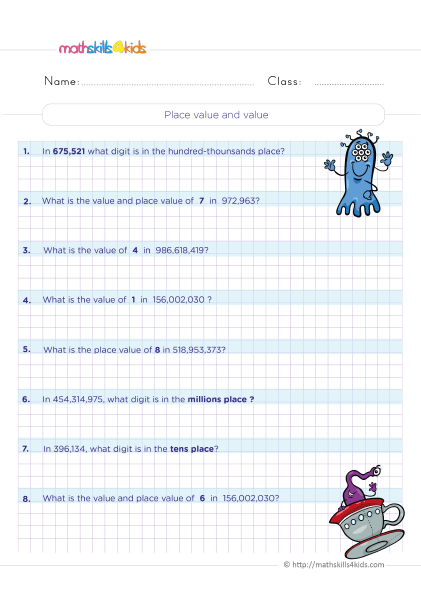
Printable PDF: 5th Grade number sense practice, 2 pages, answer key included.
See the activity: Place value to millions practice - Finding place value digits in whole numbers