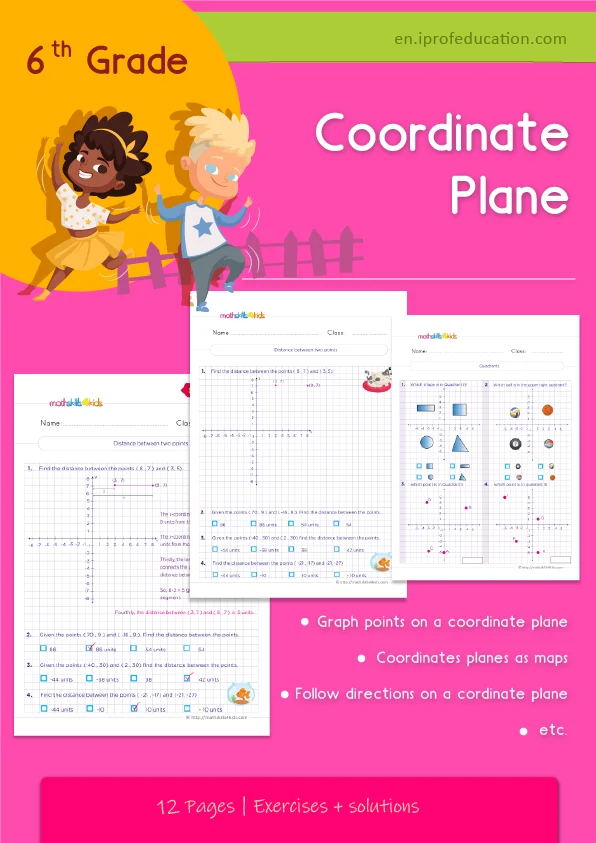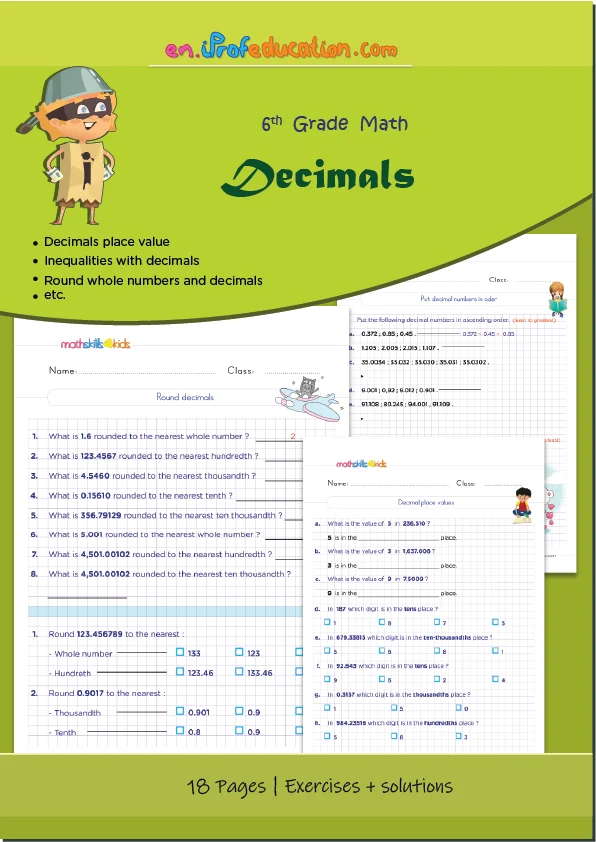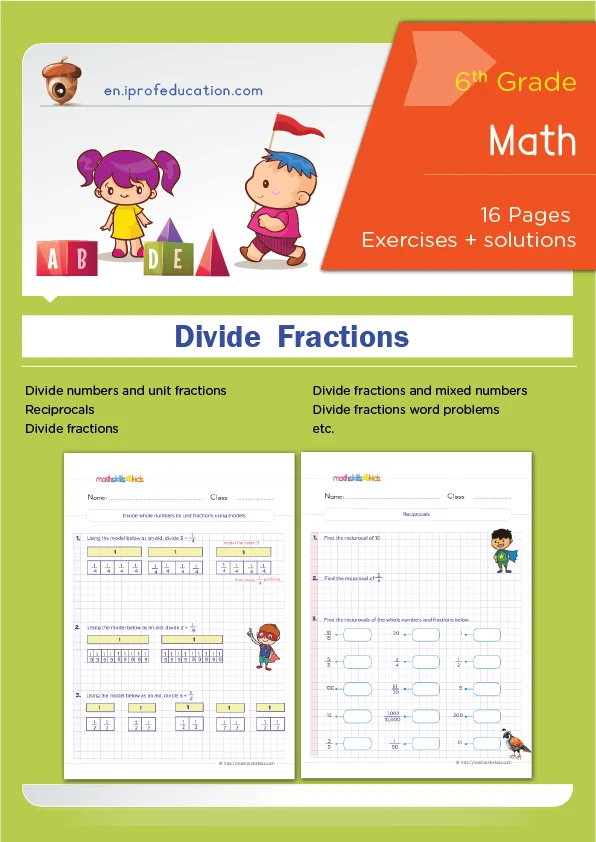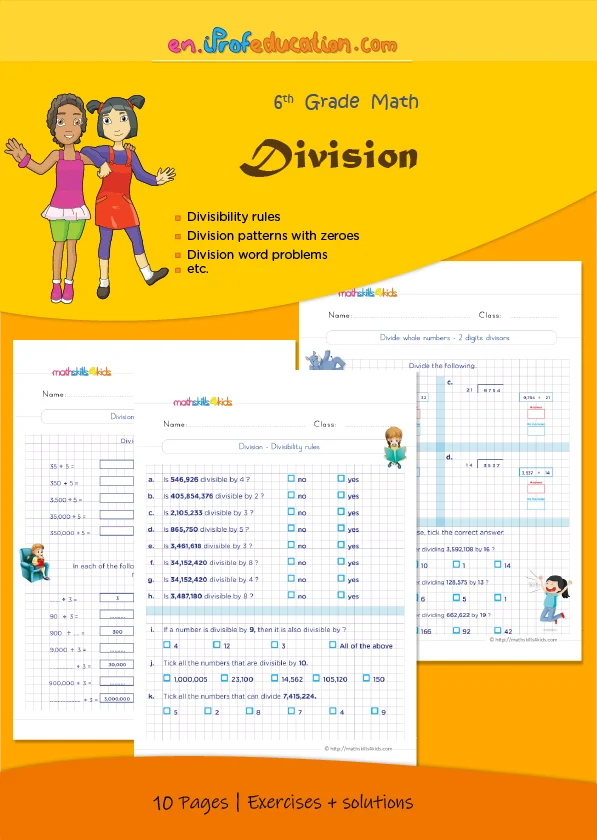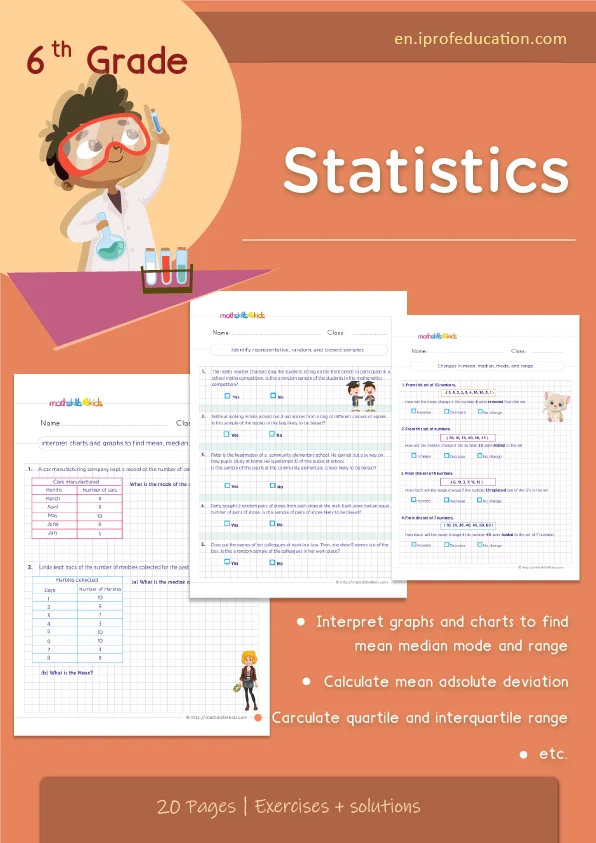
Interpreting charts and graphs to find the range
This free 5th grade interpreting charts and graphs to find the range worksheet is a 2-page printable PDF made for 5th Grade math. Kids practice interpreting charts and graphs to find the range step by step, with clear instructions and plenty of room to write. The last page is the answer key, so kids can check their work or a grown-up can correct it in a minute.
What your child will practice: Interpreting charts and graphs to find the range
This sheet belongs to the Probability and statistics topic of 5th Grade. It focuses on one skill, interpreting charts and graphs to find the range, so kids can repeat the same kind of exercise until it feels easy.
- Read each instruction before starting.
- Solve the exercises in order: they get a little harder as you go.
- Show the work, not only the answer.
How to use this worksheet
- Download the PDF and print it (A4 or US Letter, “fit to page”).
- Read the instructions aloud with younger kids.
- Let your child work alone first, then help only where they get stuck.
- Check the answers with the answer key on the last page.
After the page: keep practicing
A few minutes a day works better than one long session. When this sheet feels easy, try the next one in the series or play a game on the same skill.
More practice: 5th Grade probability and statistics worksheets and games.
About this 5th Grade probability and statistics worksheet
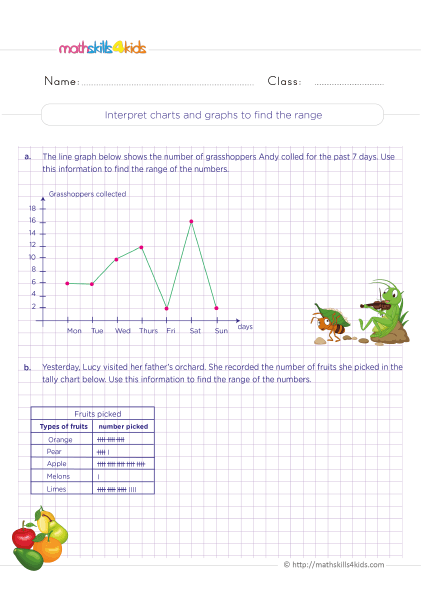
Download the worksheet: Interpreting charts and graphs to find the range
Download the PDF (opens in a new tab)Free · 2 pages · 1.4 MB · answer key included
🍪 Free worksheets are paid for by ads
To download for free, please accept cookies, or go Premium for an ad-free experience.
A few related activities
Understanding probability
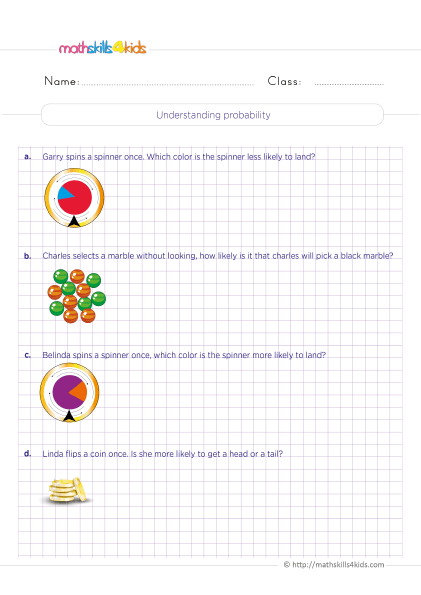
Printable PDF: 5th Grade probability and statistics practice, 2 pages, answer key included.
See the activity: Understanding probabilityShort stories for making predictions
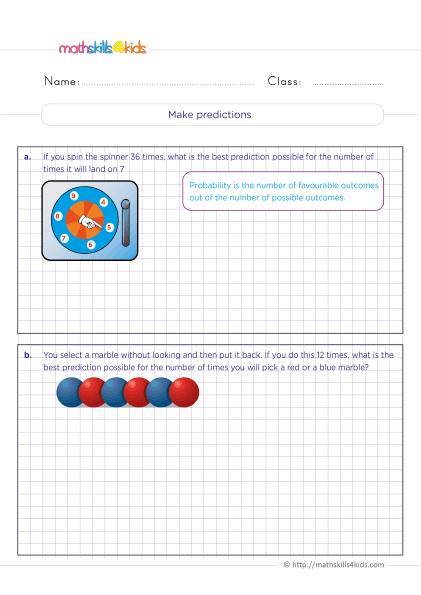
Printable PDF: 5th Grade probability and statistics practice, 2 pages, answer key included.
See the activity: Short stories for making predictionsHow to find the mode of charts and graphs?
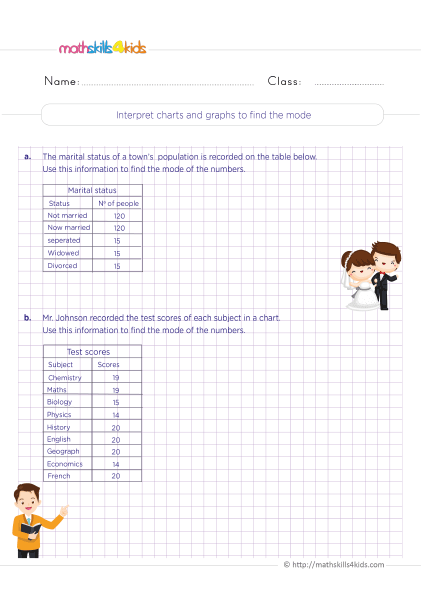
Printable PDF: 5th Grade probability and statistics practice, 2 pages, answer key included.
See the activity: How to find the mode of charts and graphs?Interpreting charts and graphs to find the mean
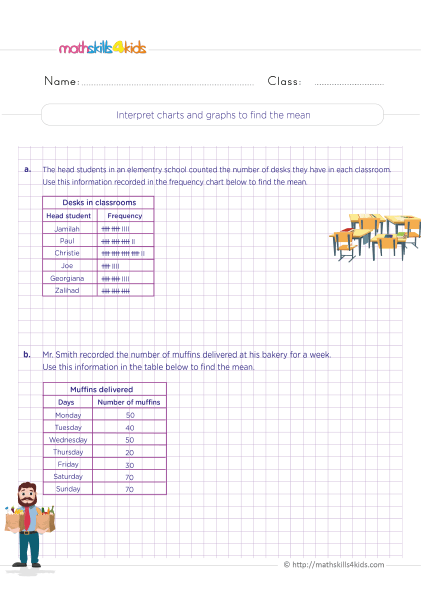
Printable PDF: 5th Grade probability and statistics practice, 2 pages, answer key included.
See the activity: Interpreting charts and graphs to find the meanHow to find the median of charts and graphs?
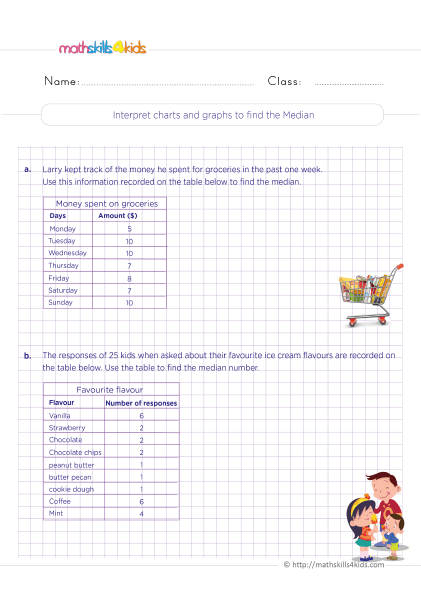
Printable PDF: 5th Grade probability and statistics practice, 2 pages, answer key included.
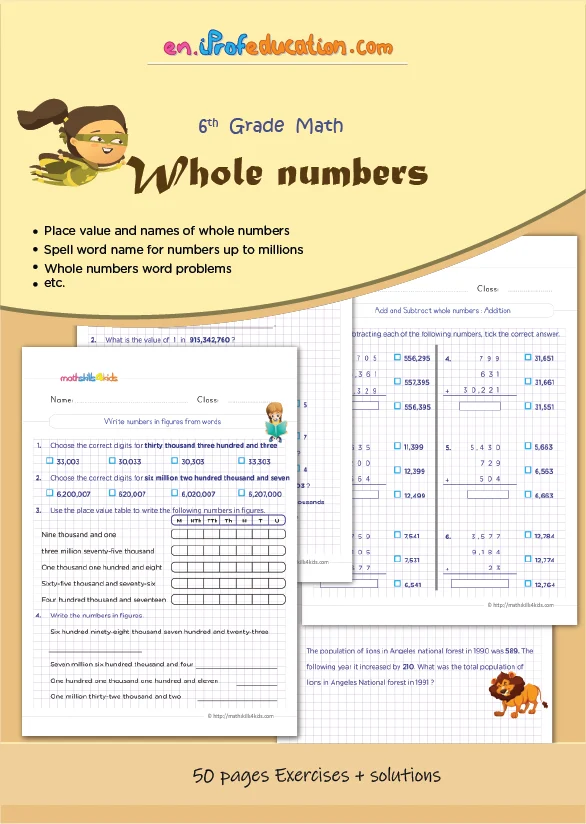
See the activity: How to find the median of charts and graphs?Place value to millions practice - Finding place value digits in whole numbers
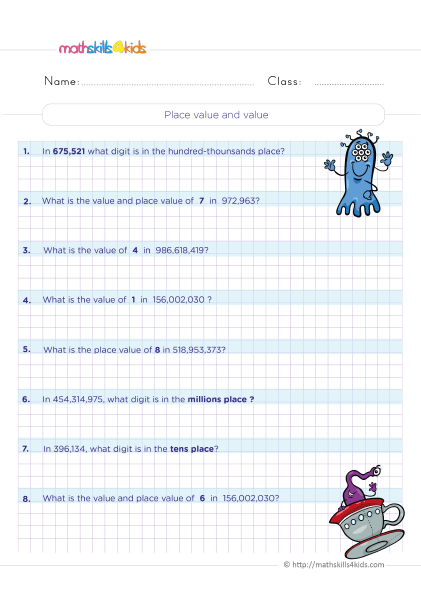
Printable PDF: 5th Grade number sense practice, 2 pages, answer key included.
See the activity: Place value to millions practice - Finding place value digits in whole numbers