Fun and engaging first-Grade graphing & data worksheets and activities
Hello, teachers and parents! Are you looking for some fun and engaging ways to teach your first-graders about graphing and data? If so, you've come to the right place! In this fun resource, we'll share with you some awesome graphing and data worksheets and activities that you can use in your classroom or at home with your kids.
Let's get started!
-
These resources will help your students develop essential math skills such as collecting, organizing, analyzing, and interpreting data using pictographs, bar graphs, tally charts, and tables.
Why graphing and data skills are essential for first-Graders
Graphing and data skills are essential for first-graders because they help them understand the world. By learning how to collect and represent data in different ways, students can make sense of information, identify patterns and trends, compare and contrast different sets of data, and draw conclusions based on evidence.
Graphing and data skills also support math concepts such as counting, addition, subtraction, measurement, and geometry. Plus, graphing and data are fun and interactive topics allowing students to explore their interests and questions.
-
BROWSE THE WEBSITE
-
DOWNLOAD FREE WORKSHEETS
-
-
1st GRADE MATH TOPICS
- Counting and numbers
- Understand addition
- Addition skills
- Addition exercises
- Addition strategies
- Understand subtraction
- Subtraction skills
- Subtraction Exercises
- Subtraction strategies
- Mixed operation
- Comparing numbers up to 100
- Estimation Worksheets
- Place value
- Spatial sense
- Graphing & data
- Measurement
- Patterns
- Probability
- Sorting & classifying
- Telling time
- 2D shapes
- 3D shapes - Solids figures
- Fractions
-
-
How to introduce graphing and data concepts with pictographs and bar graphs
One of the best ways to introduce graphing and data concepts to first-graders is by using pictographs and bar graphs.
Pictographs are graphs that use pictures or symbols to represent data.
Bar graphs use horizontal or vertical bars to show the quantity or frequency of data.
Both types of graphs are easy to read and understand for young learners. To introduce pictographs and bar graphs, you can use the following steps:
- Start by asking your students a question that can be answered with data. For example, "What is your favorite color?" or "How do you get to school?".
- Have your students collect the data by surveying their classmates or using existing data sources such as books or websites.
- Have your students organize the data using tally marks or a table to record the results.
- Have your students represent the data by creating a pictograph or a bar graph using paper, crayons, stickers, or online tools.
- Have your students interpret the data by asking questions such as "Which category has the most/least?" or "How many more/less?".
-
Collect and analyze data through surveys and tally charts
Another way to teach your first-graders about graphing and data is by having them collect and analyze data through surveys and tally charts.
Surveys are questions that ask for opinions or preferences on a topic.
Tally charts are tables that use marks or symbols to track how often something occurs.
Surveys and tally charts are great tools for engaging students in authentic data collection and analysis.
To use surveys and tally charts in your classroom or at home, you can follow these steps:
- Please choose a topic that interests your students or relates to their learning. For example, "What is your favorite animal?" or "What do you like to do after school?".
- Have your students create a survey question with two or more choices. For example, "Do you like cats or dogs better?" or "Do you like to read or play games after school?".
- Have your students survey their classmates, family members, or friends using oral or written methods.
- Have your students record the data using a tally chart with columns for each choice and rows for each respondent.
- Have your students analyze the data by counting the tally marks for each choice and comparing the results.
-
Awesome graphing and data worksheets for first-Grade Math
If you're looking for some ready-made graphing and data worksheets for your first-grade math lessons, look no further! We've compiled a list of some awesome graphing and data worksheets you can download and print for free.
These worksheets cover various skills, such as counting, completing, interpreting, and comparing graphs using pictographs, bar graphs, tally charts, and tables.
Here are some examples of the worksheets:
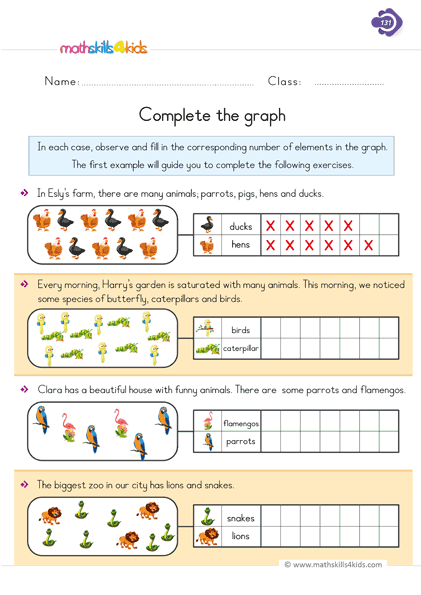
- Simple counting and completing graph activity: This worksheet asks students to count the number of objects in each category and complete a pictograph using stickers or drawings.
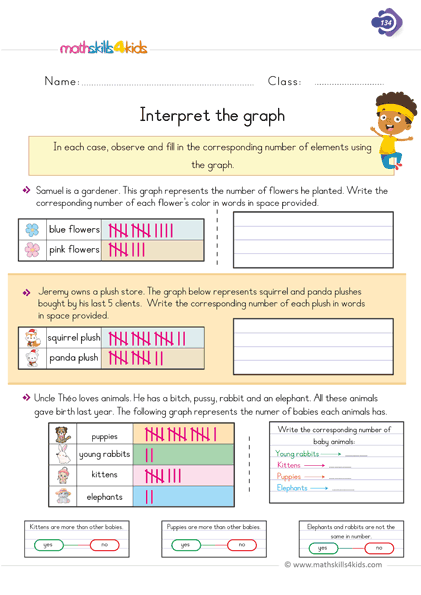
- Interpreting a simple collected data: This worksheet asks students to interpret a pictograph that shows the favorite fruits of a group of children by answering questions such as "How many children like apples?" or "Which fruit is the least favorite?".
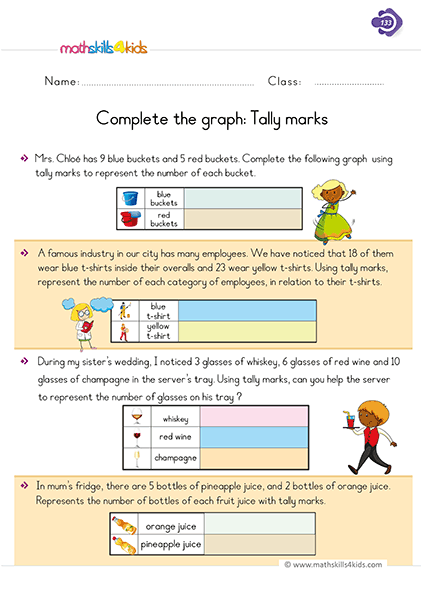
- Completing the graph using tally marks: This worksheet asks students to complete a bar graph using tally marks based on a table that shows the number of pets owned by a group of children.
- Interpreting data from tally marks graph: This worksheet asks students to interpret a bar graph that shows the number of pets owned by a group of children by answering questions such as "How many children have no pets?" or "How many more children have dogs than cats?".
- Which Table is Correct? - Interpret the Collected Data: This worksheet asks students to choose the correct table that matches a given pictograph that shows the favorite sports of a group of children.
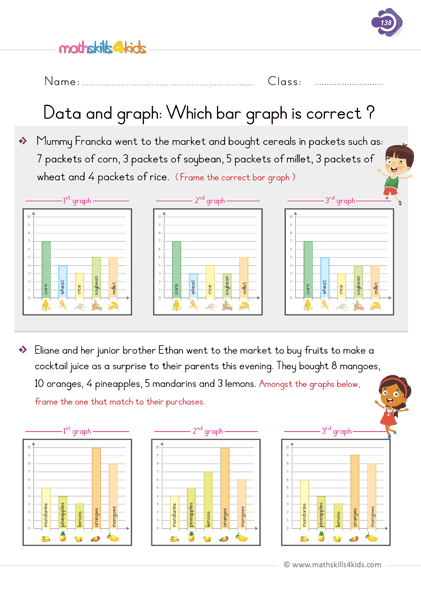
- Which Graph is Correct? - Interpret a Bar Graph: This worksheet asks students to choose the correct bar graph that matches a given table that shows the number of books read by a group of children.
-
5 Creative graphing and data activities to try in your classroom
If you want to spice up your graphing and data lessons, don't hesitate to try using our fun, creative graphing and data activities in your classroom or at home.
These activities are designed to help your students practice and apply their graphing and data skills in different contexts and formats.
Here are some examples of the activities:
- Candy Graphing: Give each student a small bag of candy (such as M&M's or Skittles) and have them sort, count, and graph their candy by color using a pictograph or a bar graph.
Then, have them interpret and compare their graphs by asking questions such as "Which color has the most/least candy?" or "How many more/less candy do you have than your partner?".
- Weather Graphing: Have your students keep track of the weather for a week or a month by recording the temperature, precipitation, wind, and cloudiness using a table or a chart.
Then, have them graph their data using a line graph or a pie chart.
Then, have them interpret and compare their graphs by asking questions such as "What was the highest/lowest temperature?" or "Which day was the sunniest/cloudiest?".
- Animal Graphing: Have your students research and collect data about different animals, such as their habitats, diets, sizes, lifespans, etc., using books or websites.
Then, have them graph their data using a Venn diagram or a double-bar graph.
Then, have them interpret and compare their graphs by asking questions such as "Which animals live in both land and water?" or "Which animals are bigger/smaller than humans?".
- Birthday Graphing: Have your students create a class birthday calendar by writing their names and birthdates on sticky notes and placing them on a large poster board.
Then, have them graph the data by creating a pictograph or a bar graph that shows the number of birthdays in each month.
Then, have them interpret and compare their graphs by asking questions such as "Which month has the most/least birthdays?" or "How many more/less birthdays are there in January than in June?".
- Name Graphing: Have your students write their names on index cards and cut out each letter.
Then, have them sort, count, and graph their letters by using a pictograph or a bar graph.
Then, have them interpret and compare their graphs by asking questions such as "Which letter is the most/least common in your name?" or "How many more/less letters do you have than your partner?".
- Candy Graphing: Give each student a small bag of candy (such as M&M's or Skittles) and have them sort, count, and graph their candy by color using a pictograph or a bar graph.
-
How to use graphs to compare and contrast different sets of data
One of the most important skills that first-graders need to learn is how to use graphs to compare and contrast different sets of data. By doing so, they can develop critical thinking and problem-solving skills that will help them in math and beyond.
To teach your students how to use graphs to compare and contrast different sets of data, you can use the following steps:
- Choose two sets of data that are related or relevant to what your students are learning. For example, "The number of boys and girls in each class" or "The height and weight of different animals."
- Have your students create two graphs that represent each set of data using the same type of graph (such as pictographs or bar graphs) or different types of graphs (such as line graphs or pie charts).
- Have your students compare and contrast the two graphs by looking for similarities and differences in the data such as shape, size, position, quantity, frequency, etc.
- Have your students write or discuss their observations using comparative words such as more, less, same, different, higher, lower, etc.
-
How to assess and reinforce graphing and data learning outcomes
Apart from teaching your first graders about graphing skills, you must also assess and reinforce their graphing and data-learning outcomes.
By doing so, you can check for understanding, provide feedback, identify strengths and weaknesses, and plan for future instruction.
To assess and reinforce graphing and data learning outcomes, you can use the following strategies:
- Use formative assessments such as exit tickets, quizzes, games, or oral questions to check for understanding during or after each lesson.
- Use summative assessments such as tests, projects, or portfolios to measure mastery at the end of a unit or a semester.
- Use reinforcement activities such as puzzles, coloring pages, or crafts to review and practice graphing and data skills in a fun and engaging way.
- Use differentiation strategies such as scaffolding, grouping, or tiering to meet the diverse needs and abilities of your first-graders.
- Use feedback strategies such as praise, correction, or suggestions to help your first-graders improve their graphing and data performance and confidence.
These methods are great for assessing and reinforcing students' graphing and data learning outcomes in a fun and interactive way!
Bonus: Find More Resources to Reinforce Data and Graphing Learning in First Grade here!
If you're looking for more fun and engaging ways to help your first-graders master data and graphing skills, you're in luck! I have some amazing resources to share with you that will make your math lessons a blast.
First, check out these awesome graphing and data activities pages that you can download for free. They include:
- A colorful pictograph poster that shows how to read and interpret pictographs. You can use this as a reference tool or a classroom display.
- A set of 12 pictograph task cards that challenge students to answer questions based on different pictographs. These are great for math centers, small groups, or independent work.
- A fun bar graph game that lets students create and compare their own bar graphs using dice and counters. This is a hands-on way to practice collecting and representing data.
- A cute animal survey worksheet that asks students to collect data from their classmates about their favorite animals and then make a tally chart and a bar graph. This is a perfect activity to integrate math and science.
You can find these activities pages here: https://www.education.com/worksheets/first-grade/graphing-data/
But wait, there's more! I also have some amazing graphing and data worksheets for first-grade math that you can use to reinforce and assess your students' learning. These worksheets cover:
- Reading and making pictographs with up to four categories
- Reading and making bar graphs with up to four categories
- Comparing data using words like more, less, same, most, least
- Solving word problems using data from graphs
These worksheets are aligned with the Common Core Standards and are perfect for homework, review, or assessment. You can find them here: https://www.k5learning.com/free-math-worksheets/first-grade-1/data-graphing
Thank you for sharing the links of MathSkills4Kids.com with your loved ones. Your choice is greatly appreciated.
-
Data and graphing are essential skills for first-graders to learn. They help them organize, represent, and interpret information in meaningful ways. They also prepare them for more advanced math topics in the future.
By using fun and engaging worksheets and activities, you can make data and graphing lessons exciting and enjoyable for your students. They will love collecting and analyzing data using pictographs, bar graphs, surveys, and tally charts.
I hope you found this blog post helpful and inspiring. If you did, please share it with your friends and colleagues. And don't forget to check out my website for more awesome resources for first-grade math.
Happy teaching!