Types of graphs and charts used in data analysis
In data analysis, graphs and charts are powerful tools for visually representing data and making it easier to understand. Several types of graphs and charts are commonly used in data analysis, each with its purpose and advantages.
The most common types include bar graphs, line graphs, and pie charts.
Bar graphs: how to create and interpret them
Bar graphs are a popular choice for displaying categorical data. They consist of rectangular bars of various lengths, each representing a different category or group. To create a bar graph, students will collect data, organize it into categories, and then plot the data on the graph.
Interpreting a bar graph involves analyzing the lengths of the bars to understand the relationships between different categories. Students can compare the heights of the bars to determine which category has the highest or lowest value. They can also identify patterns or trends in the data by examining the relative heights of the bars.
Line graphs: a visual representation of data trends
Line graphs are used to show the relationship between two variables. They are beneficial for displaying data that changes over time. In a line graph, data points are plotted on a grid, and lines are drawn to connect these points. Students can visualize the trend or pattern in the data by connecting the dots.
Line graphs help students understand how variables are related and how they change in response to different factors. They can also make predictions or extrapolate data beyond the plotted points.
Pie charts: understanding proportions and percentages
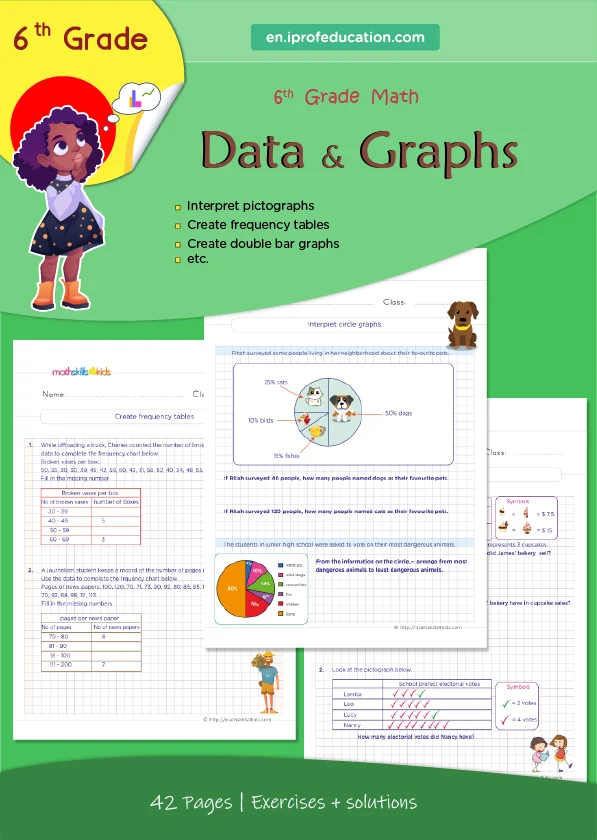
Pie charts are circular graphs divided into slices, each representing a different category or group. The size of each slice corresponds to the proportion or percentage of the whole. Pie charts are useful for showing how a whole is divided into parts and comparing the sizes of different categories.
Students can analyze a pie chart to understand each category's relative proportions and percentages. They can also calculate angles to determine the exact percentage represented by each slice.