Kindergarten math: Data and graphing worksheets and activities
Hello, math teachers! Get the best of our Kindergarten math resource designed to help you teach data and graphing skills to your little ones in an enjoyable way. In essence, we will share some of our favorite data and graphing worksheets and activities that we use in the classroom to help students learn how to collect, organize, display, and interpret data using graphs.
-
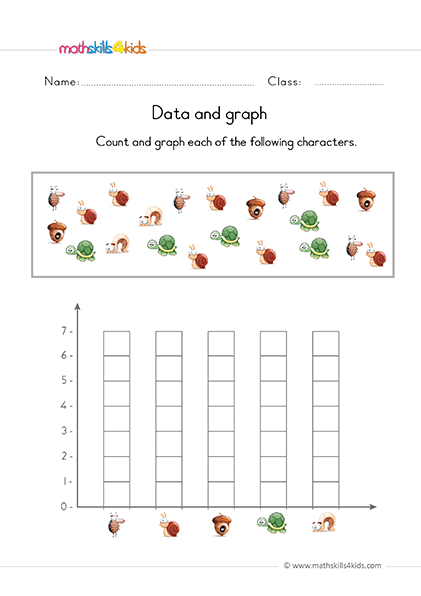
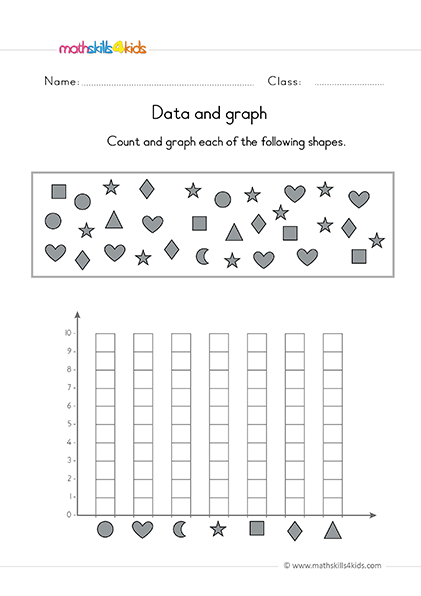
We will use pictures and graphs stimulating kids to sort objects by different categories, count the number of things in each category, and compare numbers. Also, these graphing worksheets will allow kids to read and follow simple instructions that will enable them to answer and plot questions quickly.
These are all easy to implement, low-prep, and aligned with the Common Core Standards for kindergarten math. Let's get started!
How to teach your kids to count to 10 with fun math worksheets
Data and graphing activities for kindergarten: Learn to collect, organize and display dataTeaching data and graphing activities to kindergarteners is one of the most enjoyable experiences you will encounter with your students at home or in the classroom. A better way to introduce this concept is by helping them learn how to collect, organize and display data using different tools and methods.
Data is a way of collecting information about the world and making sense of it. It can help us answer questions, solve problems, and communicate information quickly and accurately while having fun.
-
BROWSE THE WEBSITE
-
DOWNLOAD FREE WORKSHEETS
-
-
K- MATH TOPICS
- Learn to count up to 3
- Counting from 1 to 5
- Count up to 10
- Learn to count up to 20
- Counting to 100
- Skip counting
- Measurement
- Sum and difference
- Comparison
- Patterns
- Addition up to 5
- Addition up to 10
- Subtraction up to 5
- Subtraction up to 10
- 2D shapes
- Introduction to symmetry
- Position
- Fractions
- Time
- Classify
- Data and graph
- Probability
- 3D shapes
-
-
Fun and easy ways to make graphs with young learners
Teach your young learners how to make graphs using fun and easy ways. One way is to use real-life objects that they can manipulate and explore.
For example, you can use candy, cereal, stickers, buttons, or other small items in your classroom. You can also use pictures of animals, shapes, colors, or anything else your students are interested in.
The idea is to have your students sort the items into different categories and then make a graph to show how many items are in each category. You can use different types of graphs depending on the level of your students, such as bar graphs, pictographs, or tally charts. Here are some examples of worksheets that you can use to practice making graphs with real-life objects:
Candy Graphing: Give each student a small bag of candy (such as M&M's or Skittles) and have them sort the candy by color. Then have them fill in a bar graph or a pictograph to show how many candies they have of each color.
You can also have them answer some questions about their graph, such as which color has the most or the least candies or how many more candies they have of one color than another.
Cereal Graphing: Give each student a small cup of cereal (such as Froot Loops or Cheerios) and have them sort the cereal by shape or color. Then have them fill in a bar graph or a pictograph to show how many cereal pieces they have of each shape or color.
You can also have them answer some questions about their graph, such as which shape or color has the most or the least pieces of cereal or how many more pieces of cereal they have of one shape or color than another.
Sticker Graphing: Give each student a sheet of stickers (such as animals, stars, hearts, or letters) and have them sort the stickers by type. Then have them fill in a bar graph or a pictograph to show how many stickers they have of each type.
You can also have them answer some questions about their graph, such as which type has the most or the least stickers or how many more stickers they have of one type than another.
-
Data and graphing games and activities for the classroom
Another way to make data and graphing fun and interactive for your students is to use games and activities that involve collecting and analyzing data.
For example, you can use surveys, polls, spinners, dice, cards, or dominoes to generate data and then have your students make graphs to display the data.
You can also use games and activities to interpret data from already-made graphs. Here are some examples of games and activities that you can use to practice data and graphing skills in your classroom:
Survey Says: Have your students conduct a survey on a topic they are interested in, such as their favorite food, animal, sport, or color.
Have them ask their classmates or other people in the school their opinion on the topic and record their responses using a tally chart. Then have them make a bar graph or a pictograph to show their survey results. You can also have them write a sentence or two about what they learned from their survey.
Spin and Graph: Have your students use a spinner (such as a paper clip and a pencil) to generate data on a topic you choose, such as shapes, colors, numbers, or letters. Have them spin the spinner several times and record their results using a tally chart. Then have them make a bar graph or a pictograph to show their data.
You can also have them answer some questions about their graph, such as which category has the most or the least spins or how many more spins they have of one category than another.
Roll and Graph: Have your students use dice (one or two) to generate data on a topic that you choose, such as numbers (1-6), sums (2-12), differences (1-5), or even/odd numbers. Have them roll the dice several times and record their results using a tally chart. Then have them make a bar graph or a pictograph to show their data.
You can also have them answer some questions about their graph, such as which number has the most or the least rolls or how many more rolls they have of one number than another.
-
What can we learn from data and graphs?
One of the main goals of teaching data and graphing skills to kindergarten students is to help them develop critical thinking and problem-solving skills.
Students can learn how to make comparisons, draw conclusions, and communicate information effectively by collecting, organizing, displaying, and interpreting data using graphs. For example;
Students can learn how to compare two data sets using graphs, such as which set has more or less items or greater or smaller values.
Students can also learn how to draw conclusions from graphs, such as what patterns, trends, or relationships they can observe in the data or what predictions they can make based on the data.
Moreover, they can learn how to communicate information using graphs, such as how to label the axes, titles, and categories of a graph or how to write sentences or paragraphs that describe what the graph shows.
-
Tips and tricks for teaching data and graphing skills
Teaching data and graphing skills to kindergarten students can be challenging and rewarding, especially when using fun tips and tricks.
Data and graphs help young learners make sense of the world around them, compare and contrast different information sets, and communicate their findings effectively.
Here are some tips and tricks for teaching data and graphing skills to your kindergarten students:
Start with concrete objects. Kindergarten students must see and touch the data they are working with, so you must use real objects or pictures to collect and display data. For example;
You can use fruits, toys, stickers, or buttons to make graphs on a large paper or a bulletin board. You can also use manipulatives like cubes, counters, or beads to make graphs on a mat or a table.
Use simple graphs. Kindergarten students need more time to be ready for complex graphs like bar graphs, line graphs, or pie charts. Instead, use simple graphs like pictographs, tally charts, or Venn diagrams.
These graphs are easy to understand and create, and they show the data clearly and visually. You can also use digital tools like apps or websites to create simple graphs with your students.
Ask questions. Questions are essential for teaching data and graphing skills, as they help students analyze and interpret the collected and displayed data. Ask questions that prompt students to describe the graph, compare the data, identify patterns or trends, draw conclusions, and make predictions.
For example, you can ask: "What does this graph show?", "Which category has the most/least?", "How many more/less/fewer?", "What do you notice about this graph?", "What can we learn from this graph?", "What would happen if...?"
Make connections. Data and graphing skills are not separated from other math skills or other subject areas. Make connections between data and graphing and other math topics like counting, sorting, adding, subtracting, measuring, or geometry.
You can also connect data, graphing, and other subjects like science, social studies, art, or literacy. For example, you can use data and graphs to explore weather, seasons, animals, plants, community helpers, shapes, colors, or letters.
Have fun. Data and graphing can be fun and engaging for kindergarten students if you use exciting topics, games that motivate them, and activities that challenge them.
You can use surveys or polls to collect data about your students' preferences, opinions, hobbies, or favorites. You can also use games like bingo, memory, or matching to practice data and graphing skills.
You can also use activities like scavenger hunts, treasure maps, or puzzles to create and solve problems using data and graphs.
Bonus: Some fun and engaging data graphing activities for kindergarteners
Graphing is a fun and useful way to learn about data and how to represent it. There are several graphing activities that you can do with different objects, such as toys, coins, or stickers.
You can use a pocket chart or paper to make a pictograph, which is a graph that uses pictures to show data. You can also make a target graph, which is a graph that shows how many times you hit a target with a dart or a pom-pom.
You can do these graphing activities for kindergarten at home or in the classroom. Here are two examples that offer some ideas:
Example : Graphing with Froot Loops
You will need: a box of Froot Loops cereal, a paper plate, a pencil, and a graphing worksheet.
- Step 1: Give each student a handful of Froot Loops and a paper plate. Ask them to sort the Froot Loops by color and place them on the plate.
- Step 2: Give each student a graphing worksheet. Ask them to count how many Froot Loops they have of each color and write the number in the box.
- Step 3: Ask them to color the boxes to make a bar graph. For example, if they have four red Froot Loops, they should color four boxes red.
- Step 4: Ask them to look at their graphs and answer some questions. For example, which color do they have the most of? Which color do they have the least of? How many Froot Loops do they have in total?
- Step 5: Let them eat their Froot Loops as a reward!
This activity is easy and yummy!
Example : Graphing with Toys
You will need: some toys that can be sorted by different attributes, such as cars, trains, animals, etc., a large piece of paper, a marker, and some tape.
- Step 1: Choose one attribute to sort the toys by, such as color, size, type, etc. For example, you can sort the toys by color.
- Step 2: Tape the paper to the wall or the floor and draw a large grid with the marker. Label each column with a different category of the attribute. For example, if you are sorting by color, you can label the columns red, blue, green, etc.
- Step 3: Give each student a toy and ask them to place it in the correct grid column. Repeat until all the toys are sorted.
- Step 4: Ask them to look at the grid and answer some questions. For example, which column has the most toys? Which column has the least toys? How many toys are there in total?
- Step 5: Let them play with the toys as a reward!
These activities are fun and engaging!
-
Thank you for sharing the links of MathSkills4Kids.com with your loved ones. Your choice is greatly appreciated.
Data and graphing are important skills for kindergarten students to develop as they prepare for more advanced math concepts in the future. By using these tips and tricks, you can make data and graphing fun and easy for your young learners.
Happy counting!
Useful links
3 Easy Graphing Activities For Kindergarten | Simply Kinder :
https://www.simplykinder.com/graphing-activities-for-kindergarten/
25 Creative Graphing Activities Kids Will Enjoy | Teaching Expertise :
https://www.teachingexpertise.com/classroom-ideas/graphing-activities/