Analyzing graphs: How to identify patterns, trends, outliers, and errors in graphs
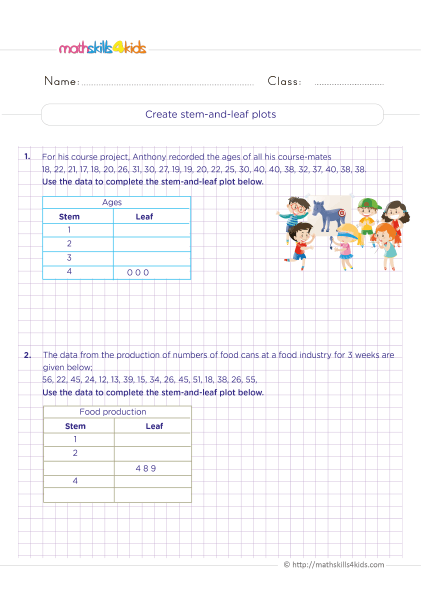
One of the most essential skills for 6th graders is to be able to analyze graphs and data. Analyzing means to examine something closely and carefully to understand what it means. When we analyze graphs, we can look for four things: patterns, trends, outliers, and errors.
Patterns are repeated or regular shapes or arrangements in the data. For example, if we have a graph that shows the number of books read by different students in a month, we might see a pattern of increasing or decreasing numbers. Patterns can help us see how the data is organized and related.
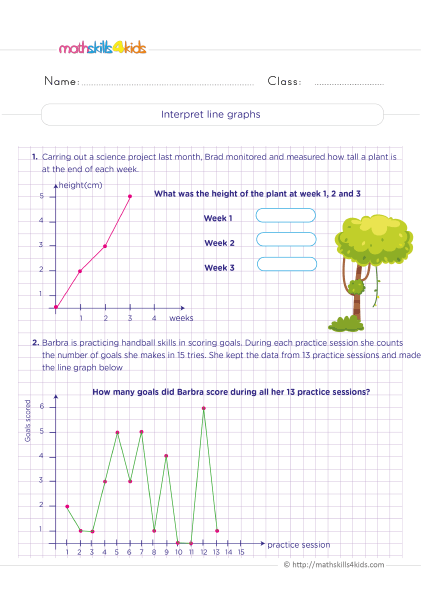
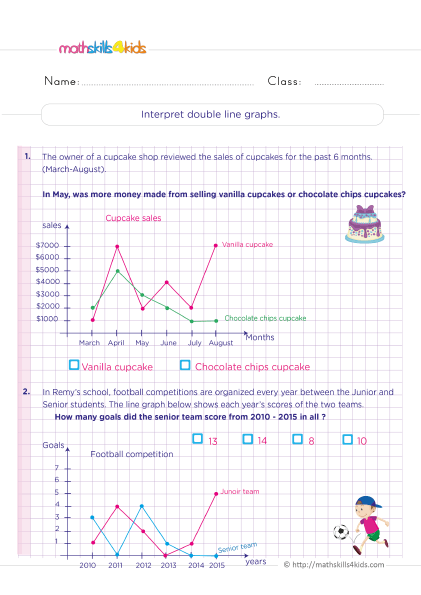
Trends are general directions or tendencies in the data. For example, if a graph shows a city's average temperature over a year, we might see a trend of rising or falling temperatures. Trends can help us see how the data changes over time or across categories.
Outliers are data points that are very different from the rest of the data. For example, if we have a graph showing the height of different plants in a garden, we might see an outlier much taller or shorter than the others. Outliers can help us see if there are any unusual or exceptional cases in the data.
Errors are mistakes or inaccuracies in the data or the graph. For example, if we have a graph showing the population of different countries worldwide, we might see an error with a wrong number or a missing label. Errors can affect how we interpret and trust the data and the graph.
To analyze graphs and data, we need to ask ourselves some questions:
- What is the purpose and audience of the graph?
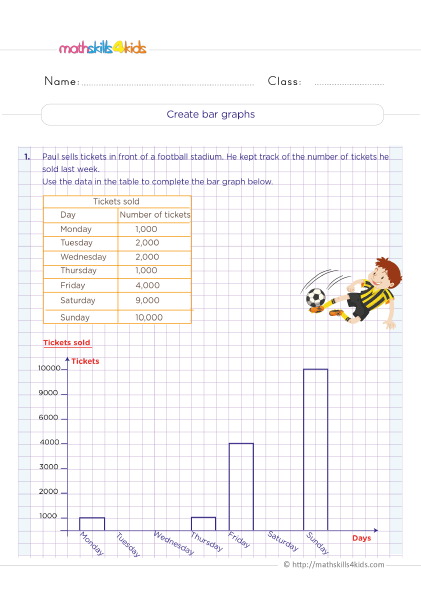
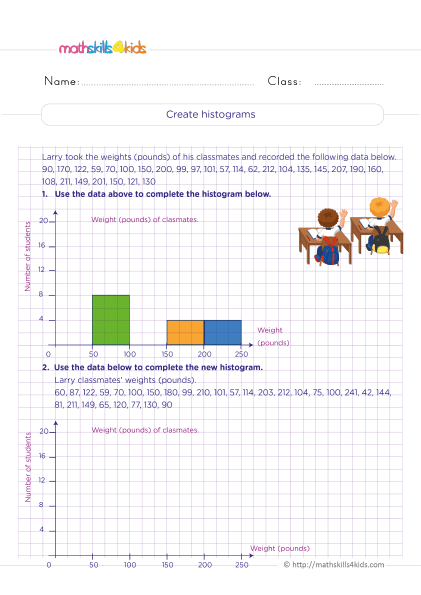
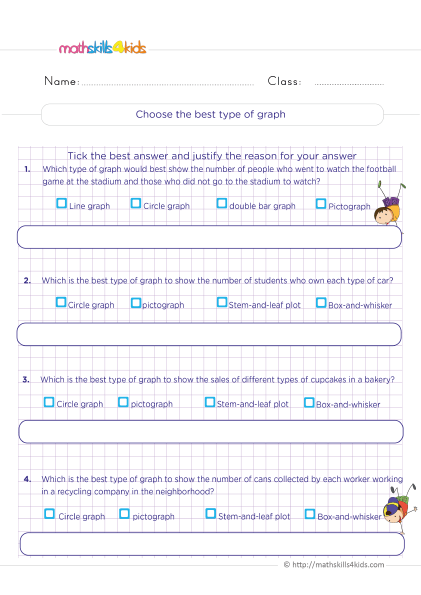
- What type of data and graph is used?
- What are the scales, labels, and titles of the graph?
- What patterns and trends can we see in the data?
- Are there any outliers or errors in the data or the graph?
- What conclusions or inferences can we make from the graph?
Your 6th-grade students can improve their critical thinking and problem-solving skills by asking and answering the questions above.