Free printable 3rd-grade data, graphing, and probability worksheets
Are you a teacher or parent and need a perfect way to capture your 3rd grader’s interest and love for data and graphing math activities? Look no further. This article will provide free printable 3rd-grade data, graphing, and probability worksheets from Mathskills4kid.com.
-
These amazing printable data worksheets cover important math topics designed with visual simulations like colorful objects and real-life images that will stimulate your kid’s eagerness to learn without getting tired.
Also, these worksheets are perfect for reinforcing what your child learns at school or for homeschooling.
Why data, graphing, and probability skills are essential for 3rd graders
Data, graphing, and probability skills are essential for 3rd graders because they help them develop their logical thinking, problem-solving, and communication skills. Data is information that can be collected, organized, and analyzed. Graphing is a way of visually displaying data using different charts and graphs. Probability is the likelihood of something happening or not happening.
By learning about data, graphing, and probability, using Mathskills4kids data worksheets, your 3rd graders can:
- Understand how to collect and organize data using surveys, tables, and charts
- Interpret and compare data using different types of graphs, such as bar graphs, line plots, pictographs, and line graphs
- Make predictions and draw conclusions based on data
- Understand how to use coordinate planes to locate and plot points
- Recognize and describe patterns and trends in data
- Understand the concept of probability and how to express it using words and fractions
- Identify and compare events that are certain, probable, unlikely, or impossible
- Conduct simple experiments to test the probability
-
BROWSE THE WEBSITE
-
DOWNLOAD FREE WORKSHEETS
-
-
3rd GRADE MATH TOPICS
- Number and compapring
- Place value
- Addition
- Subtraction
- Understand multiplication
- Multiplication skill builders
- Multiplication fluency
- Multiplication
- Understand division
- Division skill builders
- Division fluency
- Division practice
- Mixed operation
- Properties
- Equations & variations
- Estimate & rounding
- Logical reasoning
- Patterns
- Money
- Telling time
- Data graph & probability
- Understanding fractions
- Equivalent fractions
- Comparing and ordering fractions
- Operations with fractions
- Unit of measurement
- Two-dimensional shapes
- Triangles and quadrilaterals
- 3D shapes
- Geometric measurement
-
Buying is supporting us!
Buy Now...
-
-
Introduction to data and graphing
Before your 3rd Grade students become comfortable and efficient in understanding and using graphs, we’ll first introduce data and graphing to them, what they mean, and the types of graphs they will encounter.
Data is information that can be collected and organized in different ways. For example, you can collect data about your favorite animals, sports, or foods by asking questions or researching. You can also organize data using tables or charts that show how many or how much of something there is.
Graphing is a way of displaying data visually using different types of graphs. Graphs help us see patterns and trends in data more easily than just looking at numbers. They also help us compare data and make predictions.
3rd graders need to know how to read and create many types of graphs. Some of the most common ones are:
- Bar graphs: These graphs use bars of different heights or lengths to show how many or how much of something there is. For example, a bar graph can show how many books each student in a class reads in a month.
- Line plots: These graphs use dots or Xs to show how often something occurs. For example, a line plot can show how many minutes each student spends on homework weekly.
- Pictographs: These graphs use pictures or symbols to represent data. For example, using apple icons, a pictograph can show how many apples each student ate in a day.
- Line graphs: These graphs use lines to show how something changes over time. For example, a line graph can show how the temperature changes throughout the day.
-
Probability and Chance
Probability is the likelihood of something happening or not happening. Probability can be expressed using words like certain, probable, unlikely, or impossible. For example:
- It is certain that the sun will rise tomorrow.
- It is probable that it will rain today.
- It is unlikely that you will win the lottery.
- It is impossible that you will grow wings.
Probability can also be expressed using fractions such as 1/2, 1/4, 3/4, etc. For example:
- The probability of getting heads when flipping a coin is 1/2.
- The probability of getting an even number when rolling a die is 1/2.
- The probability of getting a red card when drawing from a deck of cards is 1/2.
- The probability of getting a face card when drawing from a deck of cards is 3/13.
To find the probability of an event, we can use this formula:
Probability = Number of favorable outcomes / Total number of possible outcomes
For example:
- The probability of getting tails when flipping a coin is 1/2 because there is one favorable outcome (tails) out of two possible outcomes (heads or tails).
- The probability of getting a 6 when rolling a die is 1/6 because there is one favorable outcome (6) out of six possible outcomes (1, 2, 3, 4, 5, or 6).
- The probability of getting a blue marble when picking from a bag of marbles is 4/10 because there are four favorable outcomes (blue marbles) out of ten possible outcomes (four blue marbles and six red marbles).
We can also conduct simple experiments to test probability. For example, we can flip a coin 10 times and record how many times we get heads or tails. Then, we can compare the results with the expected probability of 1/2.
-
How to use Mathskills4kids’ free printable 3rd-grade data, graphing, and probability worksheets to reinforce learning at home
These free printable worksheets are designed to help your 3rd grader practice and master data, graphing, and probability skills. They are aligned with the Common Core State Standards for Mathematics and cover all the abovementioned topics. However, to use these free printable 3rd-grade data, graphing, and probability worksheets to reinforce kid’s learning at home;
You can print out as many copies as you need and use them as homework, review, or extra practice. You can also laminate them and use dry-erase markers to make them reusable.
Each worksheet has clear instructions and examples to guide your child. Some worksheets also have answer keys to check your child's work.
In addition to these worksheets, you can find more fun and engaging activities in Mathskills4kids.com that you can also try to practice data, graphing, and probability concepts with your 3rd grader:
Objects on a coordinate plane
Use a sheet of graph paper to create a coordinate plane with four quadrants. Label the x-axis (horizontal) and y-axis (vertical) with numbers from -10 to 10. Then, plot points on the coordinate plane using small objects such as stickers, buttons, or beads.
For example, you can plot the point (3, -5) by placing an object on the intersection of the line x = 3 and y = -5. You can also draw shapes using multiple points and label them with letters or names.
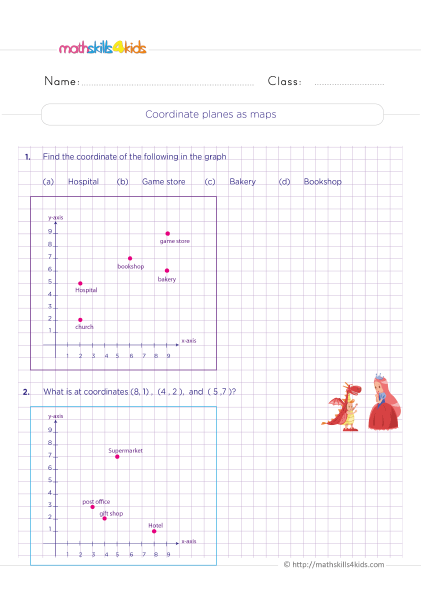
Coordinate planes as maps
Use a sheet of graph paper to create a coordinate plane with four quadrants. Label the x-axis (horizontal) and y-axis (vertical) with numbers from -10 to 10. Then, use the coordinate plane as a city or neighborhood map. Draw landmarks such as buildings, parks, or roads using shapes and label them with names.
For example, you can draw a square for a school and label it S. Then, use coordinates to describe the location of each landmark. For example, you can say that the school is at (5, 2).
Graph points on a coordinate plane
Use a sheet of graph paper to create a coordinate plane with four quadrants. Label the x-axis (horizontal) and y-axis (vertical) with numbers from -10 to 10. Then, write down a list of coordinates such as (-4, 6), (0, -8), (7, -3), etc. Ask your child to graph each point on the coordinate plane using a pencil or a marker.
You can also ask your child to name the quadrant where each point is located.
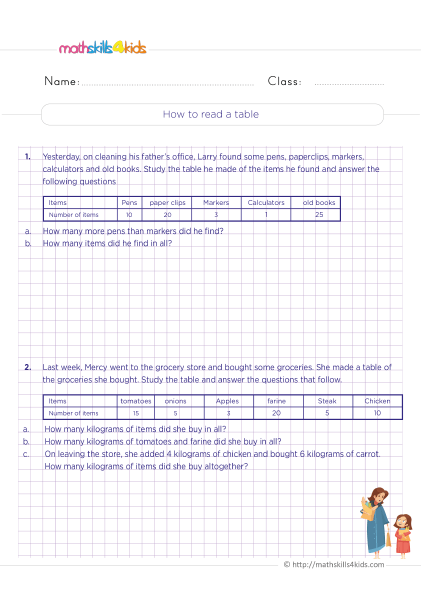
Reading a table
Find a table that shows data about something that interests your child, such as animals, sports, or foods. For example, you can find a table that shows the height and weight of different animals. Ask your child to read the table and answer questions such as:
- How many rows and columns does the table have?
- What are the labels for each row and column?
- What is the value in each cell?
- What is the highest or lowest value in each row or column?
- How can you compare the values in different rows or columns?
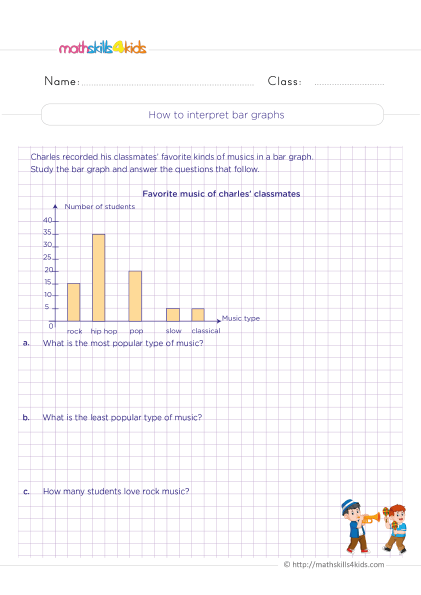
Interpreting and creating bar graphs
When interpreting and creating bar graphs, first, find a bar graph that shows data about something that interests your child, such as books, movies, or games. For example, you can find a bar graph that shows how many books each student in a class reads in a month. Ask your child to interpret the bar graph and answer questions such as:
- What is the title of the bar graph?
- What are the labels for each axis?
- What are the scales for each axis?
- How many bars are there in the bar graph?
- What does each bar represent?
- How high or long is each bar?
- What is the highest or lowest bar in the bar graph?
- How can you compare the bars in the bar graph?
Then, ask your child to create their bar graph using data they collect or choose. For example, they can create a bar graph that shows their favorite colors, fruits, or hobbies. They can use paper and pencils or online tools such as https://www.mathsisfun.com/data/bar-graph.html to make bar graphs.
Use bar graphs to solve problems
Bar graphs are not only useful for displaying data but also for solving problems. For example, you can use a bar graph to compare the number of students who like different types of pizza and then find out which pizza is the most popular or the least popular.
You can also use a bar graph to answer questions such as how many more students like pepperoni than cheese or what fraction of the students like pineapple.
These free printable worksheets will give your 3rd grader plenty of practice using bar graphs to solve problems. They will learn how to read and interpret bar graphs and create their own bar graphs from given data. They will also learn how to use different scales and units on a bar graph's vertical and horizontal axes.
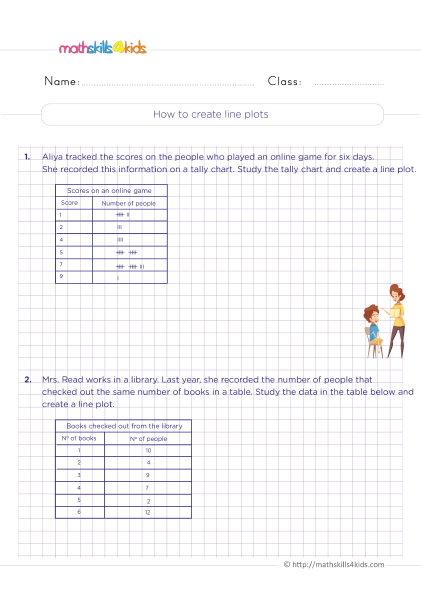
Interpreting and creating line plots
A line plot is another way of showing data on a number line. A line plot uses Xs or dots to mark the frequency of each value in a data set. For example, you can use a line plot to show how many books each student in a class read in a month or how many minutes each student spent on homework.
Line plots are especially useful for showing data that involve fractions or decimals, such as the lengths of different objects or the weights of different animals.
These free printable 3rd-grade data, graphing, and probability worksheets will help your 3rd-grader learn how to interpret and create line plots with whole numbers, fractions, and decimals. They will also learn how to use line plots to answer questions such as finding a data set's mean, median, mode, and range or comparing two data sets.
Creating line plots with fractions
One of the skills that 3rd graders need to master is creating line plots with fractions. This means that they need to be able to measure objects using fractional units, such as half inches or quarter inches, and then record the measurements on a line plot.
For example, they can measure the lengths of different pencils using a ruler with fractional markings and then make a line plot to show the data.
Creating line plots with fractions helps 3rd graders develop their understanding of fractions as parts of a whole and their ability to compare and order fractions.
These free printable worksheets will provide your 3rd grader with plenty of practice in creating line plots with fractions. They will also learn how to use line plots with fractions to answer questions such as finding equivalent fractions, simplifying fractions, and adding or subtracting fractions.
Interpreting and creating pictographs
A pictograph is a graph that uses pictures or symbols to represent data. For example, you can use a pictograph to show how many apples each student in a class ate in a week or how many pets each student has at home.
Each picture or symbol in a pictograph usually represents more than one data unit, such as 5 apples or 2 pets. The key of a pictograph tells you how many units each picture or symbol represents.
Pictographs are fun and easy to understand for 3rd graders, as they can relate to the pictures or symbols used.
These free printable worksheets will teach your 3rd grader to interpret and create pictographs from given data. They will also learn how to use pictographs to answer questions such as finding the total, difference, or average of a data set or comparing two data sets.
Interpreting and creating line graphs
A line graph is another type of graph that shows how data changes over time or across categories. A line graph uses points connected by lines to show the relationship between two variables. For example, you can use a line graph to show how the temperature changes throughout the day or how the height of a plant grows over several weeks.
Line graphs are useful for showing trends or patterns in data, such as increasing, decreasing, or staying constant.
These free printable worksheets will help your 3rd grader learn to interpret and create line graphs from given data. They will also learn how to use line graphs to answer questions such as finding a data set's maximum, minimum, or rate of change or predicting future values based on past data.
Count shapes in a Venn diagram
A Venn diagram is a diagram that uses circles to show the relationships between different sets of objects or information. For example, you can use a Venn diagram to show which shapes have certain attributes, such as corners or curves. The circles in a Venn diagram can overlap or not overlap depending on whether the sets have common elements or not.
Counting shapes in a Venn diagram helps 3rd graders practice their counting, sorting, and logical thinking skills.
These free printable worksheets will challenge your 3rd grader to count how many shapes are in each circle, how many shapes are in the overlapping regions, and how many are outside the circles.
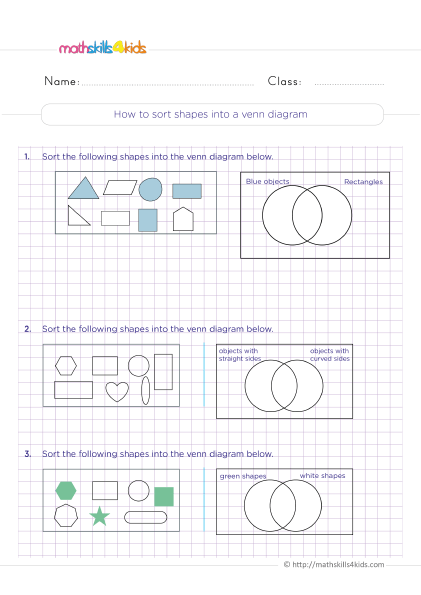
Sorting shapes into a Venn diagram
Sorting shapes into a Venn diagram is another way of using a Venn diagram to show the relationships between different sets of objects or information. For example, you can use a Venn diagram to sort shapes by their color or number of sides. The circles in a Venn diagram can overlap or not overlap depending on whether the sets have common elements or not.
Sorting shapes into a Venn diagram helps 3rd graders practice their classification, comparison, and logical thinking skills. These free printable worksheets will ask your 3rd grader to sort different shapes into the correct circles according to given criteria, such as having three sides or being red.
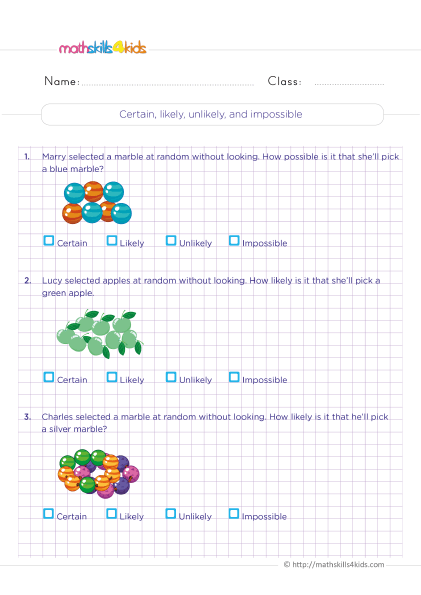
Certain, probable, unlikely, and impossible
Probability is the measure of how likely something is to happen. Probability can be expressed using words like certain, probable, unlikely, and impossible or using numbers such as fractions, decimals, or percentages. For example, the probability of rolling a 6 on a fair die is 1/6 or 16.67%, which is unlikely but possible.
Understanding probability helps 3rd graders develop reasoning, decision-making skills, and awareness of chance and uncertainty in everyday situations.
These free printable 3rd-grade data, graphing, and probability worksheets will introduce your 3rd-grader to the concepts of certain, probable, unlikely, and impossible events. They will also learn how to use words or numbers to describe the probability of simple events, such as flipping a coin or spinning a spinner.
-
Tips and tricks to help your 3rd grader master data, graphing, and probability
Data, graphing, and probability are important skills that 3rd graders need to learn and practice. They help them make sense of the world around them and prepare them for more advanced math topics in the future. Here are some tips and tricks to help your 3rd grader master data, graphing, and probability:
- Encourage your 3rd grader to collect and organize data from their interests or hobbies, such as sports scores, favorite books, or video games. They can use tables, charts, graphs, or diagrams to display their data and share it with others.
- Help your 3rd grader interpret and analyze data from different sources, such as newspapers, magazines, websites, or TV shows. They can use questions such as who, what, when, where, why, and how to guide their thinking and draw conclusions from the data.
- Play games with your 3rd grader involving data, graphing, or probability, such as bingo, dice, card, board games, or puzzles. They can use strategies such as counting, estimating, comparing, or predicting to improve their skills and have fun simultaneously.
- Explore real-life examples of data, graphing, or probability with your 3rd grader, such as weather reports, traffic patterns, surveys, polls, or experiments. They can use their observations and experiences to relate math concepts to their lives and environment.
Resources and links to learn more about data, graphing, and probability
If you want to learn more about data, graphing, and probability for 3rd graders, here are some resources and links that you can check out:
- Math is Fun: Data - This website offers clear explanations and examples of different data types and graphs for kids. https://www.mathsisfun.com/data/.
- Khan Academy: Data and Statistics - This website provides interactive lessons and videos on various topics related to data and statistics for kids. https://www.khanacademy.org/math/cc-third-grade-math/represent-and-interpret-data.
- Math Goodies: Probability - This website teaches kids the basics of probability using words and numbers. https://www.mathgoodies.com/worksheets/probability_wks.
- Math Playground: Probability Games - This website features fun and engaging games that test kids' knowledge and skills on probability. https://www.mathplayground.com/game_directory.html.
- IXL: Probability - This website offers online practice questions on different probability-related topics for kids. https://www.ixl.com/math/grade-3/find-the-probability.
-
Thank you for sharing the links of MathSkills4Kids.com with your loved ones. Your choice is greatly appreciated.
Conclusion: Keep Practicing and Have Fun
Data, graphing, and probability are essential skills that 3rd graders need to learn and practice. They help them make sense of the world around them and prepare them for more advanced math topics in the future.
These free printable 3rd-grade data, graphing, and probability worksheets will provide your 3rd-grader with plenty of practice in data, graphing, and probability concepts. They will also help them develop critical thinking, problem-solving, and communication skills.
We hope you enjoyed this article and found it useful. Please share it with your friends, family, or anyone interested in learning more about data, graphing, and probability for 3rd graders.
Thank you for reading!